Login to Ask a Question or Reply
Forum Replies Created by Indranil
-
September 21, 2017 at 12:29 pm in reply to: Incorrect label displayed for quarter of the year #16105
You can use this workaround to generate axisLabels using stripLine.
__________
Indranil Deo,
Team CanvasJSSeptember 21, 2017 at 10:24 am in reply to: No need to extra X-Axis points in the chart if there is no value over that Axis #16103Ankit,
Please create a jsfiddle reproducing the issue, so that we can understand your requirement better.
__________
Indranil Deo,
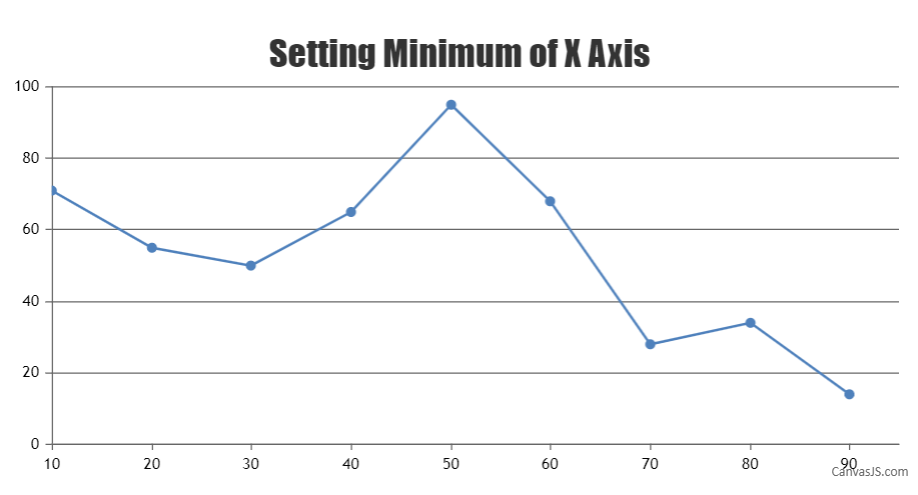
Team CanvasJSTo design a line chart that always starts from y-axis line you can set the minimum of axisX to the x-value of the first dataPoint. Please check the below code snippet –
function setAxisXMinimum(){
   chart.axisX[0].set("minimum", chart.options.data[0].dataPoints[0].x);
}
Also, kindly take a look at this JSFiddle for complete working code.

___________
Indranil Deo
Team CanvasJSThanks for reporting. We are looking into the issue. We will get back to you at the earliest.
____________
Indranil Deo,
Team CanvasJSSeptember 19, 2017 at 9:52 am in reply to: How to add a "toggle on/of" button for all the series in a Legend #16082carlo,
Glad you figured it out.
___________
Indranil Deo,
Team CanvasJSGigi,
Glad you figured it out.
____________
Indranil Deo,
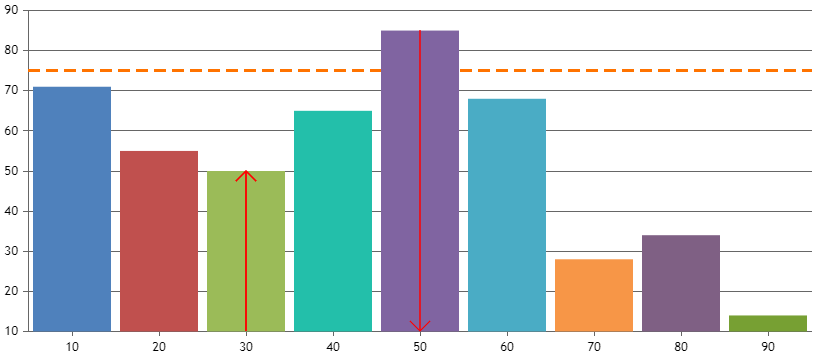
Team CanvasJSYou can draw arrow on chart based on threshold by writing few lines of code. Please refer below code snippet for the same.
function renderArrow(chart) {
  for (var i = 0; i < chart.data[0].dataPoints.length; i++) {
    if (chart.data[0].dataPoints[i].enableArrow) {
      var axisBounds = chart.axisX[0].get("bounds");
      var x1, x2, y1, y2;
      var threshold = chart.axisY[0].stripLines[0].value;

      x1 = x2 = chart.axisX[0].convertValueToPixel(chart.data[0].dataPoints[i].x);
      y1 = axisBounds.y1;
      y2 = chart.axisY[0].convertValueToPixel(chart.data[0].dataPoints[i].y);

      chart.ctx.strokeStyle = "#FF0000";
      chart.ctx.moveTo(x1, y1);
      chart.ctx.lineTo(x2, y2);
      chart.ctx.stroke();

      if (chart.data[0].dataPoints[i].y < threshold) {
        chart.ctx.moveTo(x2, y2);
        chart.ctx.lineTo(x2 + 10, y2 + 10);
        chart.ctx.moveTo(x2, y2);
        chart.ctx.lineTo(x2 - 10, y2 + 10);
        chart.ctx.stroke();
      } else {
        chart.ctx.moveTo(x1, y1);
        chart.ctx.lineTo(x1 + 10, y1 - 10);
        chart.ctx.moveTo(x1, y1);
        chart.ctx.lineTo(x1 - 10, y1 - 10);
        chart.ctx.stroke();
      }
    }
  }
}
renderArrow(chart);
Also, please check out this JSFiddle for complete working example.

___________
Indranil Deo
Team CanvasJSGlad that you figured it out. It is not working in certain browsers as you are not using the standard JavaScript Date-Time format.
__________
Indranil Deo,
Team CanvasJSCan you please provide a pictorial representation, so that we can understand your requirement better.
__________
Indranil Deo,
Team CanvasJSAre you looking for reversed Axis? In case it doesn’t suit your requirement please send us a pictorial representation or a jsfiddle so that we can understand your requirement better.
________
Indranil Deo,
Team CanvasJS-
This reply was modified 8 years, 5 months ago by
Indranil.
You can use the color property available in CanvasJS. Please take a look at this example.
_________
Indranil Deo,
Team CanvasJSHere is the link for the sample project in plain text: (https://1drv.ms/f/s!Al_ZS_39Ng7thARCrtzrXswtnz1W). It also contains ReadMe to help you set up the project on Visual Studio.
_________
Indranil Deo,
Team CanvasJSGigi,
Please take a look at this example. It creates the chart using JSON Data from an external source.
_________
Indranil Deo,
Team CanvasJSPlease take a look at this workaround. You can use the same function to manipulate your data and render Renko chart(workaround using rangeColumn).
_________
Indranil Deo,
Team CanvasJS-
This reply was modified 8 years, 5 months ago by
Indranil.
-
This reply was modified 8 years, 5 months ago by