Home Forums Chart Support Create an arrow on chart

Create an arrow on chart

Viewing 6 posts - 1 through 6 (of 6 total)
  • #16047

    Hi there, I want to add an arrow on my chart, or on the Y axis and force it to change to point up or down whether my value on chart is bigger than target or smaller.

    Kind regards,
    Michal

    #16052

    @celtas6655,

    Can you please provide a pictorial representation, so that we can understand your requirement better.

    __________
    Indranil Deo,
    Team CanvasJS

    #16054

    Hi, here’s a sample of what I would love to see on my chart.
    https://imgur.com/a/NvhzA
    Those charts are already generated, I just want to have this arrow on the middle, which will point up if my percentage is lower than the golden dotted line, and point down if values are higher than already mentioned golden dotted line.

    Kind regards

    • This reply was modified 6 years, 6 months ago by celtas6655.
    #16071

    @celtas6655,

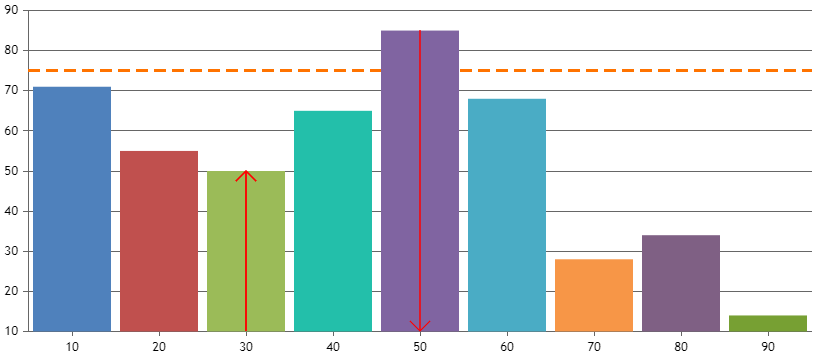
    You can draw arrow on chart based on threshold by writing few lines of code. Please refer below code snippet for the same.

    function renderArrow(chart) {
      for (var i = 0; i < chart.data[0].dataPoints.length; i++) {
        if (chart.data[0].dataPoints[i].enableArrow) {
          var axisBounds = chart.axisX[0].get("bounds");
          var x1, x2, y1, y2;
          var threshold = chart.axisY[0].stripLines[0].value;
    
          x1 = x2 = chart.axisX[0].convertValueToPixel(chart.data[0].dataPoints[i].x);
          y1 = axisBounds.y1;
          y2 = chart.axisY[0].convertValueToPixel(chart.data[0].dataPoints[i].y);
    
          chart.ctx.strokeStyle = "#FF0000";
          chart.ctx.moveTo(x1, y1);
          chart.ctx.lineTo(x2, y2);
          chart.ctx.stroke();
    
          if (chart.data[0].dataPoints[i].y < threshold) {
            chart.ctx.moveTo(x2, y2);
            chart.ctx.lineTo(x2 + 10, y2 + 10);
            chart.ctx.moveTo(x2, y2);
            chart.ctx.lineTo(x2 - 10, y2 + 10);
            chart.ctx.stroke();
          } else {
            chart.ctx.moveTo(x1, y1);
            chart.ctx.lineTo(x1 + 10, y1 - 10);
            chart.ctx.moveTo(x1, y1);
            chart.ctx.lineTo(x1 - 10, y1 - 10);
            chart.ctx.stroke();
          }
        }
      }
    }
    renderArrow(chart);

    Also, please check out this JSFiddle for complete working example.

    Drawing Arrow on Column Chart based on Threshold

    ___________
    Indranil Deo
    Team CanvasJS

    #16142

    Thank you so much for the reply, that’s exactly what I want, but I can’t get it to work with my chart generated with the use of PHP from excel file.
    Here’s the code in JSFiddle, the chart worked before I added the code with pointing arrow, but I placed there the whole code
    https://jsfiddle.net/hsywdwqn/

    #17212

    @celtas6655,

    Please create a sample project reproducing the issue along with sample data, so that we can understand it better and help you out.

    __________
    Indranil Deo,
    Team CanvasJS

Viewing 6 posts - 1 through 6 (of 6 total)

You must be logged in to reply to this topic.