Login to Ask a Question or Reply
Forum Replies Created by Indranil
-
Chaminda,
Thanks for choosing CanvasJS. I checked the status of the payment, it looks like the status of the order made through PayPal states authorized but not completed.
Once it is completed you can download the Commercial Version from Account Page.
Usually, it takes few minutes to complete the process in rare cases it is delayed.
Also, I will send you a Commercial Version through email mentioned while purchasing the License. Please check your email and download the commercial version.
___________
Indranil Deo,
Team CanvasJSYou should call chart.render() to render chart once options are set or updated. You can also use set method to achieve the same without calling chart.render() as the method re-renders chart.
chart.data[0].set("indexLabel", "{label} {y}");.
Note: Chart should be rendered once before you can use set methodWhen I do that I get some weird behavior though. The circle doesn’t redraw very well, etc.
Can you kindly create jsfiddle reproducing the issue, so that we can understand it better and help you out?
___________
Indranil Deo,
Team CanvasJSYou are setting the indexLabel at dataPoint level. Instead, setting it at dataSeries level will work fine in your case.
chart.options.data[0].indexLabel = "{label} {y}";__________
Indranil Deo,
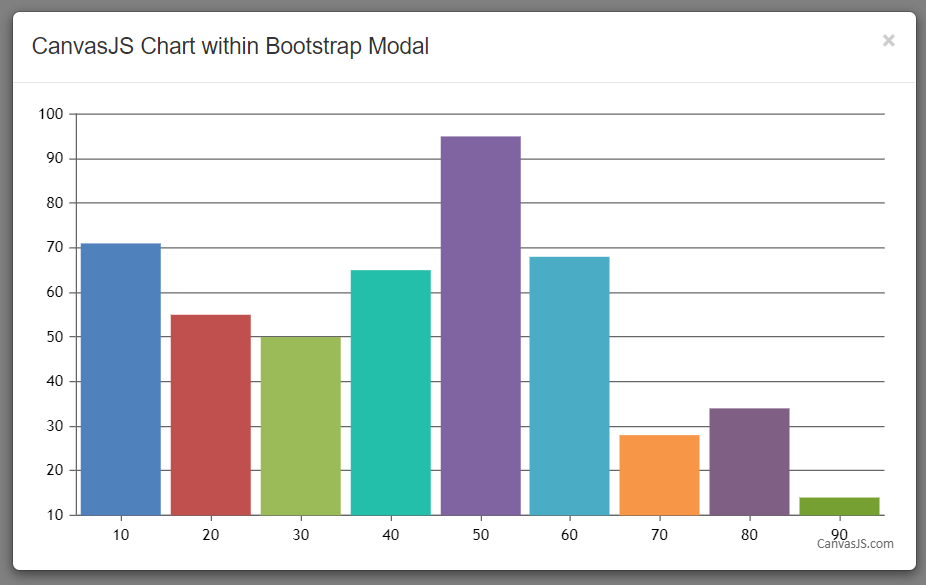
Team CanvasJSCanvasJS Chart automatically sets the width and height of the chart according to container’s dimensions. When the container’s dimension is not specified it takes up the default width & height(500px X 400px).
You would have to set 100% width for the Chart Container.
Also, in bootstrap, since the modal is not displayed initially, chart takes the default values. To solve this issue, you can render the chart when the shown.bs.modal event is fired.
$('#chartModal').on('shown.bs.modal', function () {
        chart.render();
});
Please take a look at this JSFiddle.

___________
Indranil Deo
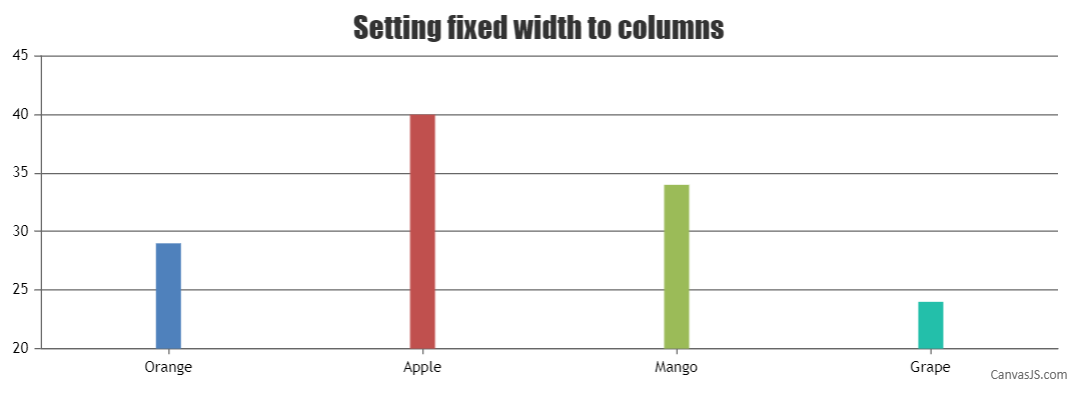
Team CanvasJSYou can set fixed column width using dataPointWidth property. Please check the below code snippet –
dataPointWidth: 20,Also, kindly take a look at this JSFiddle for a complete working code.

__________
Indranil Deo
Team CanvasJScarlo,
The code you have provided seems to be working fine across all browsers.

Kindly share the following details like browser, browser version, OS and the server on which the site is hosted locally so that we can reproduce the issue at our end and help you better.
__________
Indranil Deo,
Team CanvasJSIn JavaScript, Objects are passed as References. So, changes made to a title.text will be reflected across all charts as same object is passed as chart-options for all. Using separate options for every chart would work fine in your case.
Please take a look at the following StackOverflow links-
Javascript by reference vs. by value
Is JavaScript a pass-by-reference or pass-by-value?Also, please take a look at this updated jsfiddle.
___________
Indranil Deo,
Team CanvasJS-
This reply was modified 8 years, 4 months ago by
Indranil.
@iam,
Sorry for the inconvenience. I have discussed this with the development team & we will re-consider this behavior for the future versions.
__________
Indranil Deo,
Team CanvasJScarlo,
Thanks for your interest in CanvasJS. Surely we will assist you.
The chart might have disappeared due to some technical issues, most probably due to misconfiguration of chart options or a bug and not because of trial expiration.
The Trial expiration does not affect the rendering of the chart in any way.
Kindly check the chart options. In case if the issue still persists, please share a static file reproducing the issue to info@canvasjs.com so that we can look into it and help you out better.
For any license related query, you can contact us at sales@canvasjs.com.
__________
Indranil Deo,
Team CanvasJSRange Column Chart is suitable for your requirement. However, since your chart requires date-time value over axisY please use this workaround for the same.
_________
Indranil Deo,
Team CanvasJS@iam,
We are unable to reproduce the issue at our end and it seems to be working fine. Here is the screenshot of the same.

Can you kindly share the range (viewportMinimum and viewportMaximum) where you are facing the issue?
_________
Indranil Deo,
Team CanvasJSRon,
Thanks for reporting. We are looking into it and we will get back to you at the earliest.
__________
Indranil Deo,
Team CanvasJS -
This reply was modified 8 years, 4 months ago by