Login to Ask a Question or Reply
Forum Replies Created by Indranil
-
Can you please create a sample project reproducing the issue so that we can understand it better and help you out. Also, please share the screenshot of the issue you are facing.
__________
Indranil Deo,
Team CanvasJSExporting multiple charts as a single image is not possible as of now. The export feature is only available for individual charts.
__________
Indranil Deo,
Team CanvasJSPlease download the ASP.NET MVC sample from our gallery which uses SQL Server to populate dataPoints.
Meanwhile, we will create a sample using Oracle database and will get back to you at the earliest.
___________
Indranil Deo,
Team CanvasJSDecember 6, 2017 at 11:01 am in reply to: My chart doesn't expand inside a div tag so a scroll bar is created #17868Can you please create a sample project and share it with us so that we can look into the code and help you out.
___________
Indranil Deo,
Team CanvasJSJacob,
Dark themes are available from CanvasJS version 2.0. Please refer to this blog post for further information.
___________
Indranil Deo,
Team CanvasJSPlease replace the canvasjs.min.js and jquery.canvasjs.min.js of the Trial Version in your application with the canvasjs.min.js and jquery.canvasjs.min.js of the Version provided to you via email.
___________
Indranil Deo,
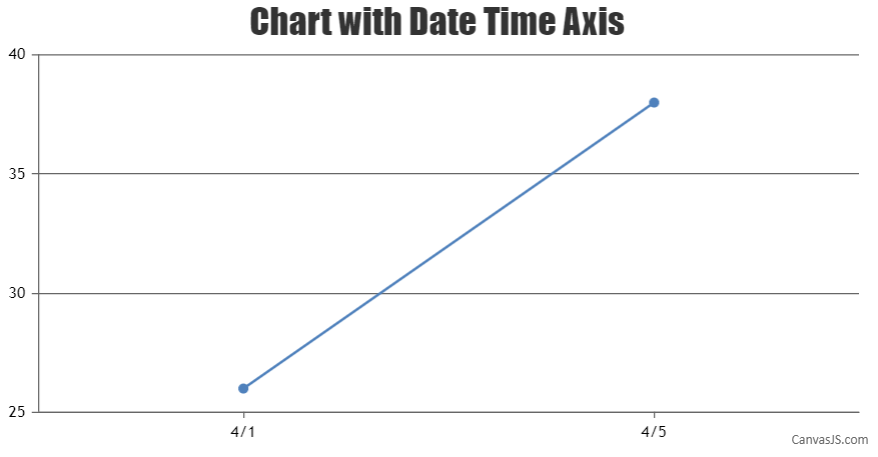
Team CanvasJSWhen we use the x-values for dataPoint, axis labels are not shown for dataPoint but at every interval of the axis. In your case, as you are trying to display axis label at specified dataPoint you can use label property in dataPoint instead of x-value as shown in the code snippet below –
[
  { label: CanvasJS.formatDate(new Date(2012, 03, 1),"M/D"), y: 26 },
  { label: CanvasJS.formatDate(new Date(2012, 03, 5),"M/D"), y: 38 }
]
Please take a look at this JSFiddle for a working example.

___________
Indranil Deo
Team CanvasJSPlease download the Commercial Version from your Account Page.
Also, you need to replace the CanvasJS source file in your application with the Commercial Version and make sure to clear the browser cache.
___________
Indranil Deo,
Team CanvasJSFor Security reasons, modern email providers have disabled Javascript for incoming emails. Hence, it is not possible to integrate CanvasJS Charts in an email.
However, you can add images of Charts as a work-around using HTML.
___________
Indranil Deo,
Team CanvasJSNovember 27, 2017 at 11:15 am in reply to: How to print just the date when importing dateTime from PHP #17711In the code snippet that you have shared, the date-time values being read from database are assigned as labels instead of assigning it as x values. Hence, setting the valueFormatString won’t work in this case. Instead, you can go with one of the following options:
1) Format the date before assigning it to the label, or
2) Pass it as date-time and assign it to x value. And format it using valueFormatString.___________
Indranil Deo,
Team CanvasJS