Login to Ask a Question or Reply
Forum Replies Created by Indranil
-
Since the y-value for each of the dataPoint is set to 0 the resulting line would be drawn corresponding to the 0 label on Axis Y. You can try shifting up the 0 label of Axis Y by setting it’s minimum to -0.5 and maximum to 0.5(which will result in shift up the dataSeries).
___________
Indranil Deo,
Team CanvasJSIt seems to be working fine. Kindly share the sample project reproducing the issue over Google-Drive or Onedrive so that we can run it locally at out end, understand the scenario better and help you out.
___________
Indranil Deo,
Team CanvasJSMarch 19, 2019 at 10:43 pm in reply to: LineChart Using Database Multiple Column separate values #24689Can you please create a working sample project with a sample database, host it in the google drive/one drive and share it with us so that we can understand your scenario better and help you out.
___________
Indranil Deo,
Team CanvasJSAre you looking for something like this? If not can you please brief me further about your requirement so that I can understand the scenario better and help you out.
___________
Indranil Deo,
Team CanvasJSYou can achieve the above requirement by parsing the dataPoints to the format accepted by CanvasJS before passing it to the chart options.
Please take a look at this Sample Project.
___________
Indranil Deo,
Team CanvasJSMarch 13, 2019 at 10:47 pm in reply to: reading text files from any location in filesystem to plot graph #24639Please take a look at this StackOverflow link for more info on moving a file from one directory to other using jQuery.
Feel free to let us know if you have any queries related to CanvasJS.
___________
Indranil Deo,
Team CanvasJSPlease take a look at this JSFiddle which shows chart with Simple Moving Average(Indicator). Similarly, you can implement other Indicators by using their respective formulas.
If you are looking for adding custom markers to the chart you can achieve it by positioning image on top of the chart.
And can CandleStick chart drag to when take new data .
Can you please brief me further about this query.
___________
Indranil Deo,
Team CanvasJSWe are closing this thread as this is a duplicate of Doughnut not show all labels. Please check/revert back in the other thread.
___________
Indranil Deo,
Team CanvasJSScott,
You can download the sample according to the technology you are using from the download page and check the example for creating charts from the database.
___________
Indranil Deo,
Team CanvasJSIn the above code snippet, indexLabels are skipped when there is limited space available for the indexLabels to display or when they get too close to other indexLabels (to avoid overlapping) – this behavior is by design. By changing startAngle by few values, it’s possible to display more indexLabels. Please take a look at this updated JSFiddle.
___________
Indranil Deo,
Team CanvasJSMarch 8, 2019 at 7:27 pm in reply to: reading text files from any location in filesystem to plot graph #24590Browsers doesn’t allow reading file from local machines due to security reasons. Please refer to this stackoverflow thread for more information.
If the file is hosted on a server you can read it using jQuery AJAX request.
___________
Indranil Deo,
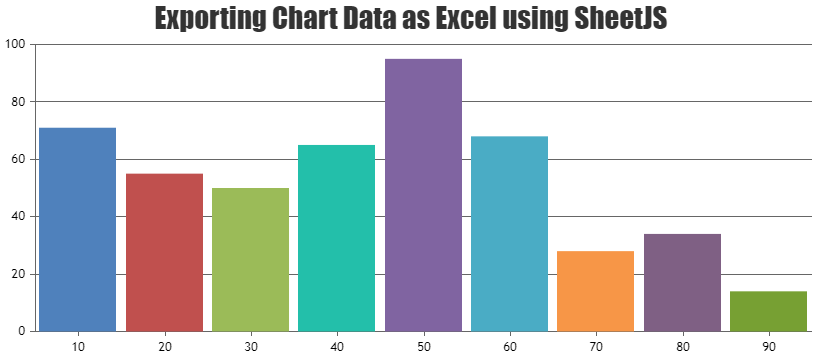
Team CanvasJSMarch 1, 2019 at 7:16 pm in reply to: Export chart to excel and edit data in excel to see changes in chart in excel? #24514Exporting chart as an image to excel is not available as an inbuilt feature as of now. However, you can use any third party plugin like SheetJS to achieve this functionality. Please check their website for more information. Also, you can check the below code snippet for exporting the chart data in .xlsx format using SheetJS –
function downloadAsExcel(args) {
  var dataPoints, filename;
  filename = args.filename || 'chart-data';

  dataPoints = args.chart.data[0].dataPoints;
  dataPoints.unshift({x: "X Value", y: "Y-Value"});
  var ws = XLSX.utils.json_to_sheet(dataPoints, {skipHeader:true, dateNF: 'YYYYMMDD HH:mm:ss'});
  if(!ws['!cols']) ws['!cols'] = [];
  ws['!cols'][0] = { wch: 17 };
  var wb = XLSX.utils.book_new();
  XLSX.utils.book_append_sheet(wb, ws, filename);
  XLSX.writeFile(wb, filename + ".xlsx");
}
Kindly check this JSFiddle for a complete working code.

___________
Indranil Deo
Team CanvasJSDisplaying a vertical label to a Stripline on Axis Y is not available as of now. However, you can workaround it by adding an extra dataSeries of Scatter chart and displaying the indexLabel for the same with indexLabelOrientation set to vertical. Please take a look at this jsfiddle.
___________
Indranil Deo,
Team CanvasJS