Login to Ask a Question or Reply
Forum Replies Created by Indranil
-
Exporting chart with toolTip is not possible as of now. However, indexLabel can be used to show extra information over the dataPoint, which can be exported using the exportChart method. Please take a look at this JSFiddle for the same. If this doesn’t help kindly brief us further about your requirement so that we can understand it better and help you out.
___________
Indranil Deo
Team CanvasJSThe link to the JSON file that you have shared seems to be not working. Please take a look at this documentation page for step-to-step tutorial on Syncing Zoom / Pan across charts along with the source code.
___________
Indranil Deo,
Team CanvasJSThanks for the suggestion. We will think about this feature in our future releases.
___________
Indranil Deo,
Team CanvasJSCanvasJS is a charting library with 30+ types of chart. It has been built from the ground up for high-performance data visualization and can render millions of data points in a matter of milliseconds.
Please feel free to let us know if you have any queries related to CanvasJS.
___________
Indranil Deo,
Team CanvasJSThanks for bringing it to our notice, we have updated the example. Please take a look at the updated code. Shifting should work fine with the updated code.
___________
Indranil Deo,
Team CanvasJSApril 22, 2019 at 7:02 pm in reply to: line graph with multiple series from csv Tagged: dataPoints, line graph, Multip #24957CanvasJS render the charts based on the dataPoints passed to it. To read a CSV file/CSV Data you will have to use an AJAX request and convert the same to CanvasJS supported format. Please refer to this StackOverflow link for more information on AJAX calls.
___________
Indranil Deo,
Team CanvasJSApril 17, 2019 at 6:57 pm in reply to: line graph with multiple series from csv Tagged: dataPoints, line graph, Multip #24920Please take a look at this documentation to render chart from CSV. Also, check this documentation on rendering dynamic chart. You can combine the given examples to achieve your requirement.
___________
Indranil Deo,
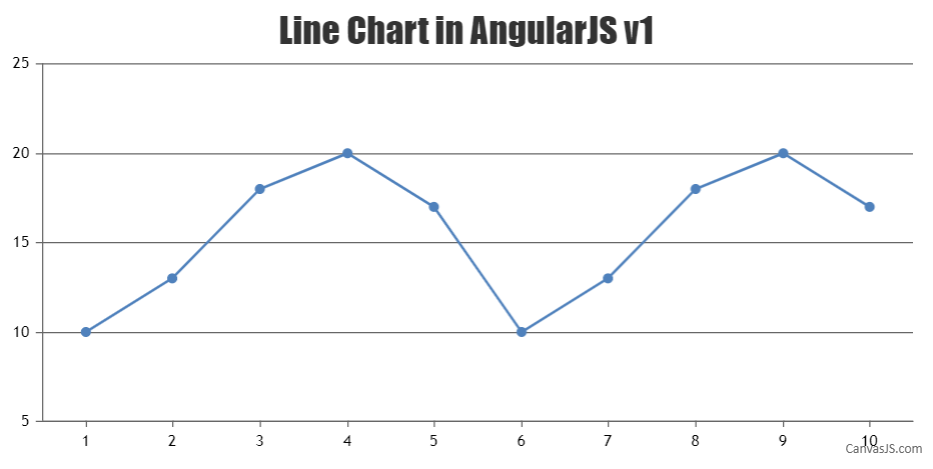
Team CanvasJSYou can integrate CanvasJS with AngularJS by rendering the chart inside a controller as shown in the code snippet below –
myapp.controller("adminDashboardController", ["$scope",function($scope){
  var dps = [{x: 1, y: 10}, {x: 2, y: 13}, {x: 3, y: 18}, {x: 4, y: 20}, {x: 5, y: 17},{x: 6, y: 10}, {x: 7, y: 13}, {x: 8, y: 18}, {x: 9, y: 20}, {x: 10, y: 17}];
  var chartOptions ={
    title: {
    	text: "Line Chart in AngularJS v1"
    },
    data: [{
      type: "line",
      dataPoints : dps
    }]
  };
  var chart = new CanvasJS.Chart("chartContainer", chartOptions);
  chart.render();
}]);
Please take a look at this JSFiddle for an example.
___________
Indranil Deo
Team CanvasJSSince there are too many consecutive Null dataPoints in the dataSeries, it’s getting overcrowded as a result the dataPoints are not visible. Setting the markerSize of the dataSeries will work fine in your case. Please take a look at this updated JSFiddle.
___________
Indranil Deo,
Team CanvasJSAre you looking for something like this? If not can you please brief me further about your requirement.
___________
Indranil Deo,
Team CanvasJSPlease contact sales[at]canvasjs[dot]com for your license related queries.
___________
Indranil Deo,
Team CanvasJSRajesh,
As of now, CanvasJS supports 30+ chart types like – line, column, spline, candlestick etc.. To add a data table to the chart you can use HTML table as shown in this JSFiddle.
___________
Indranil Deo,
Team CanvasJS