Home Forums Chart Support Export chart to excel and edit data in excel to see changes in chart in excel?

Export chart to excel and edit data in excel to see changes in chart in excel?

Viewing 5 posts - 1 through 5 (of 5 total)
  • #24395

    Can i export chart to excel and get it along with data such that i can edit data and see changes in the chart and vice versa? I can do it in python by selecting a csv file and adding the data along with its chart(not image) to an excel file and modify as needed. can we do such thing with canvasjs or javascript/jquery in general?

    I am attaching the screenshot of excel i want to have that i generated using python xlsxwriter and pandas.
    Excel generated from csv using python

    #24396

    https://ibb.co/CwpqyPj

    This is link to image.

    #24428

    @venkateshganu,

    It is possible to export the chart data in CSV format, but rendering and updating the chart within excel is not possible as of now. Please check the below code snippet to convert chart data into comma-separated CSV –

    function convertChartDataToCSV(args) {  
      var result, ctr, keys, columnDelimiter, lineDelimiter, data;
    
      data = args.data || null;
      if (data == null || !data.length) {
        return null;
      }
    
      columnDelimiter = args.columnDelimiter || ',';
      lineDelimiter = args.lineDelimiter || '\n';
    
      keys = Object.keys(data[0]);
    
      result = '';
      result += keys.join(columnDelimiter);
      result += lineDelimiter;
    
      data.forEach(function(item) {
        ctr = 0;
        keys.forEach(function(key) {
          if (ctr > 0) result += columnDelimiter;
          result += item[key];
          ctr++;
        });
        result += lineDelimiter;
      });
      return result;
    }

    Kindly take a look at this JSFiddle for a fully functional example on exporting chart data as CSV. Also take a look at this plugin, which does the same.

    exporting chart data as csv

    ___________
    Indranil Deo
    Team CanvasJS

    #24493

    Thank you for the reply. Can i atleast copy the generated canvas as image into an excel file. I can convert the canvas to image and display it on the website but i want the image to be copied to an excel file along with the table data. The image is encoded and is not getting displayed in excel and instead i get a red X sign. Is it possible to export the canvas as image to an excel file?

    #24514

    @venkateshganu,

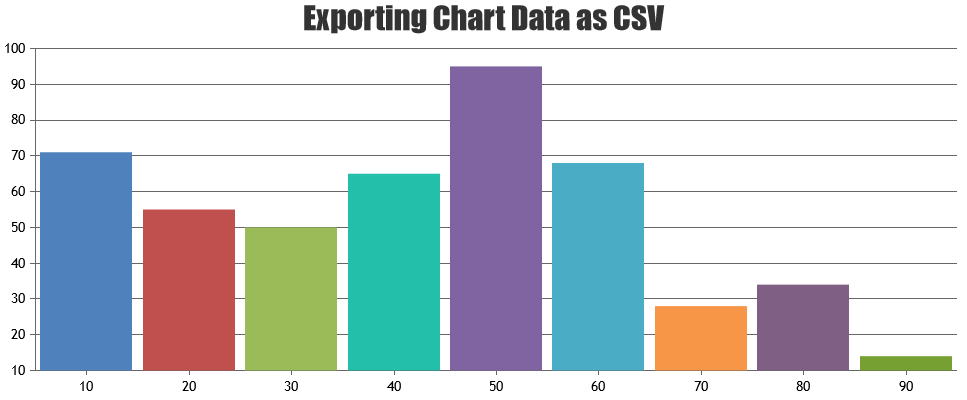
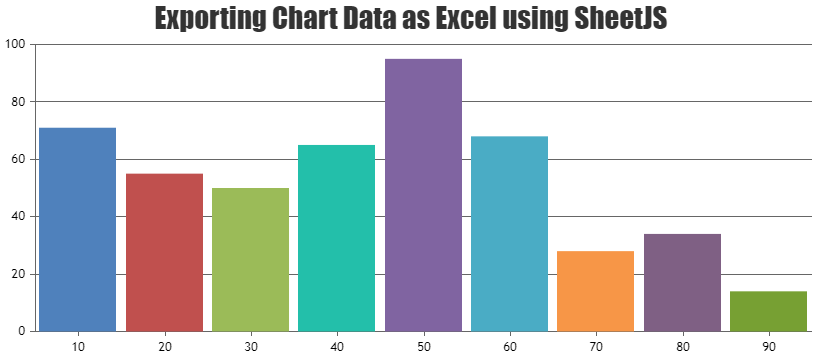
    Exporting chart as an image to excel is not available as an inbuilt feature as of now. However, you can use any third party plugin like SheetJS to achieve this functionality. Please check their website for more information. Also, you can check the below code snippet for exporting the chart data in .xlsx format using SheetJS –

    function downloadAsExcel(args) {
      var dataPoints, filename;  
      filename = args.filename || 'chart-data';
    
      dataPoints = args.chart.data[0].dataPoints;
      dataPoints.unshift({x: "X Value", y: "Y-Value"});
      var ws = XLSX.utils.json_to_sheet(dataPoints, {skipHeader:true, dateNF: 'YYYYMMDD HH:mm:ss'});
      if(!ws['!cols']) ws['!cols'] = [];
      ws['!cols'][0] = { wch: 17 };
      var wb = XLSX.utils.book_new();
      XLSX.utils.book_append_sheet(wb, ws, filename);
      XLSX.writeFile(wb, filename + ".xlsx");
    }

    Kindly check this JSFiddle for a complete working code.

    exporting chart data as excel

    ___________
    Indranil Deo
    Team CanvasJS

Viewing 5 posts - 1 through 5 (of 5 total)

You must be logged in to reply to this topic.