Login to Ask a Question or Reply
Forum Replies Created by Adithya Menon
-
August 23, 2021 at 6:31 pm in reply to: How to add custom timing line in a line graph in x axis #35262
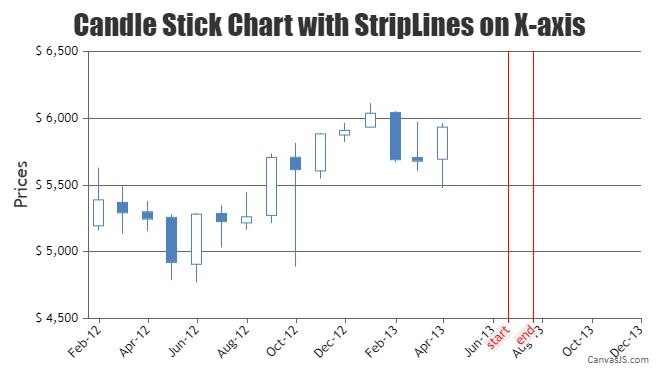
You can use stripLines on X-axis to draw a vertical line on a specific position on the chart to implement timings scale on the X-axis. To change the color of the strip lines, you can use the color property and you can use label property to set the labels for strip lines.
—
Adithya Menon
Team CanvasJSIt is possible to convert chart data into comma-separated CSV and download it with a few lines of code. Please find the code snippet for the same below,
function convertChartDataToCSV(args) {
  var result = '',
      ctr, keys, columnDelimiter, lineDelimiter, data;

  data = args.data || null;
  if (data == null || !data.length) {
    return null;
  }

  columnDelimiter = args.columnDelimiter || ',';
  lineDelimiter = args.lineDelimiter || '\n';

  var mergedData = mergeData(data);

  keys = Object.keys(mergedData[0]);
  result = '';
  result += keys.join(columnDelimiter);
  result += lineDelimiter;

  mergedData.forEach(function (item) {
    ctr = 0;
    keys.forEach(function (key) {
      if (ctr > 0) result += columnDelimiter;
      result += (typeof (item[key]) != undefined ? item[key] : "");
      ctr++;
    });
    result += lineDelimiter;
  });
  return result;
}
Please take a look at this JSFiddle for working code. Also take a look at this 3rd party plugin, which seems to be working with multi-series chart as well.
Considering this thread as a duplicate of Question about Multi Series Graph CSV Export and hence closing the same.
—
Adithya Menon
Team CanvasJSIt is possible to convert chart data into comma-separated CSV and download it with a few lines of code. Please find the code snippet for the same below,
function convertChartDataToCSV(args) {
  var result = '',
      ctr, keys, columnDelimiter, lineDelimiter, data;

  data = args.data || null;
  if (data == null || !data.length) {
    return null;
  }

  columnDelimiter = args.columnDelimiter || ',';
  lineDelimiter = args.lineDelimiter || '\n';

  var mergedData = mergeData(data);

  keys = Object.keys(mergedData[0]);
  result = '';
  result += keys.join(columnDelimiter);
  result += lineDelimiter;

  mergedData.forEach(function (item) {
    ctr = 0;
    keys.forEach(function (key) {
      if (ctr > 0) result += columnDelimiter;
      result += (typeof (item[key]) != undefined ? item[key] : "");
      ctr++;
    });
    result += lineDelimiter;
  });
  return result;
}
Please take a look at this JSFiddle for working code. Also take a look at this 3rd party plugin, which seems to be working with multi-series chart as well.
—
Adithya Menon
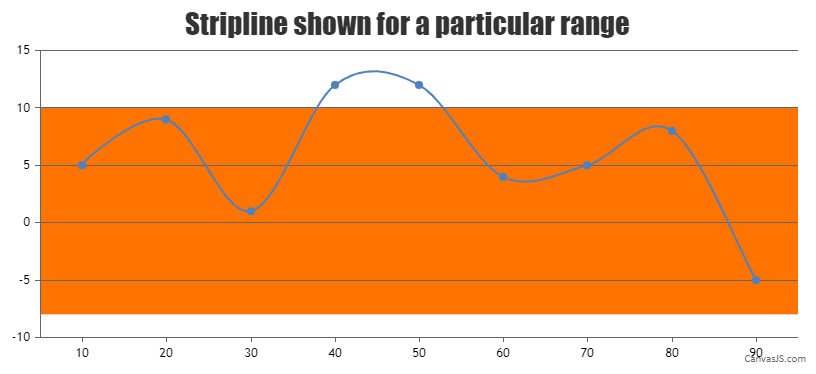
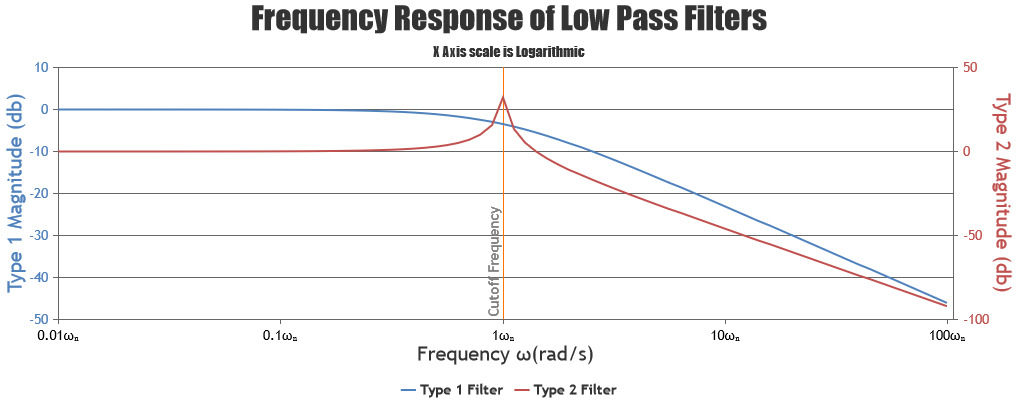
Team CanvasJSYes, it is possible to draw stripLines within a given range. You can use startValue and endValue properties to set the starting and ending position of stripline as shown in below code-snippet,
stripLines:[
  {
    startValue: -8,
    endValue:  10
  }
]
Kindly take a look at this JSFiddle for an example on showing Stripline for a particular range
—
Adithya Menon
Team CanvasJSTom,
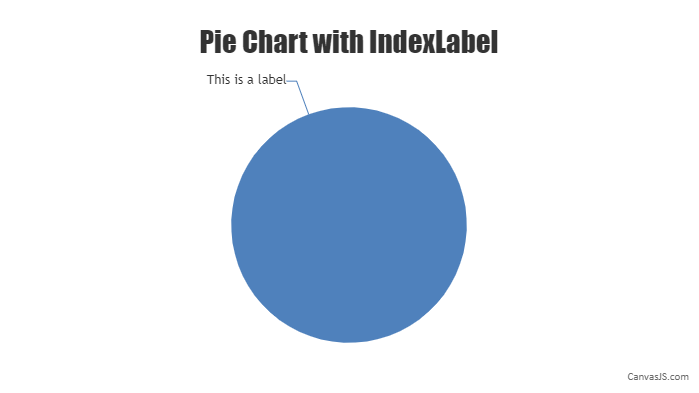
As of now, it’s not possible to control the auto-hiding of indexLabels in case of pie/doughnut charts. However, you can use startAngle property to set the starting angle of the pie which rotates it. By doing this you can try to show the maximum number of indexlabels even when the width of the chart is reduced. Please find the code snippet below,
data: [{
    type: "pie",
    startAngle: 70,
    dataPoints: [
      { label: "This is a label", y: 14}
    ]
}]
Kindly take a look at this JSFiddle for an example on a pie chart with an indexLabel.
—
Adithya Menon
Team CanvasJSGlaass Software,
It seems like you have provided us with the JSFiddle link which contains the template code (Basic Column Chart).
Please fork/save the JSFiddle reproducing the issue you are facing and share the link with us so that we can look into your code, understand the scenario better and help you out.
—
Adithya Menon
Team CanvasJSCanvasJS comes with properties like indexLabelOrientation and indexLabelPlacement which you can use to customize the index labels. However, positioning the indexLabel above the stackedBar100 is not possible as of now.

—
Adithya Menon
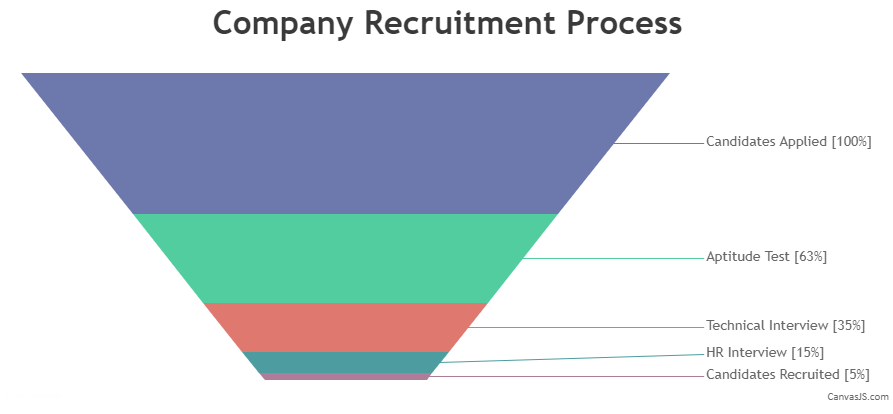
Team CanvasJSAccessibility for individual dataPoints using “Tab” key is not available as of now. However, you can provide a chart-description for a chart container by adding aria-label and tabindex, which can be read using the screen reader like windows narrator when the focus is kept on the chart. Please check the below code snippet for adding aria-label and tabindex –
var chartDescription = "A Funnel  Chart showing Company Recruitment Process where in which 63 percent of candidates cleared the aptitude test, 35 percent cleared the technical interview, 15 precent went through the HR interview and out of which 5 percent candidates were recruited";

chart.container.setAttribute("aria-label", chartDescription);
chart.container.setAttribute("tabindex", "0");
Also, kindly check this StackBlitz for an example on same.
___________
Adithya Menon
Team CanvasJSYou can get the reference to the chart instance using onRef. This allows you to access all chart properties and methods. Kindly take a look at the code snippet below for an example on exporting chart with a button click,
handleClick() {
   this.chart.exportChart({format:"png"});
}
Please find a working sample project here.
—
Adithya Menon
Team CanvasJSThe issue seems to be due to the breaking changes of ES6 modules (import and export) made in Webpack that was introduced in v2.2.0-rc.5.
Please find a working sample project here.
—
Adithya Menon
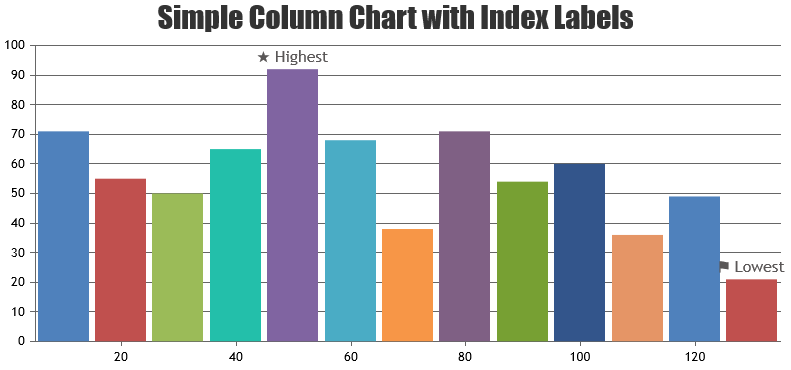
Team CanvasJSYou can show legend for each dataseries by setting showInLegend property. Please take a look at this documentation page for more information on legend & its customization options.
However, if you are looking to display some information within each column of the column chart, you can use index labels
—
Adithya Menon
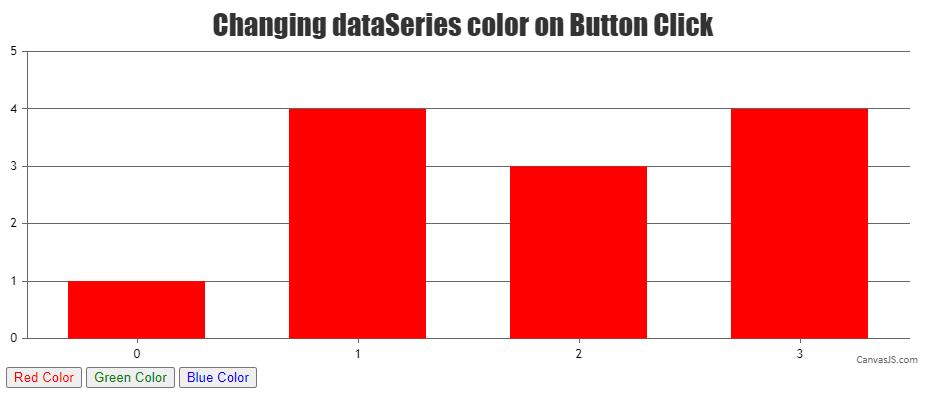
Team CanvasJSYou can use the set method to change the color of dataseries dynamically. Please find the code-snippet below,
 $(".changeColor").click(function (e) {
  chart.data[0].set("color", e.target.id)
});
Also, kindly take a look at this JSFiddle for an example with complete code.
—
Adithya Menon
Team CanvasJSJune 29, 2021 at 6:44 pm in reply to: Real time (dynamic) chart running issues on Chrome / Edge but not in Firefox #34742In Chromium-based browsers, there have been various restrictions on background tabs to mitigate the dramatic negative effect on browser performance. In case of chrome, since chrome version 57 a budget-based timer throttling was introduced placing an additional limit on background timer CPU usage.
Please refer to the Google blog post for more info.
—
Adithya Menon
Team CanvasJSThe legend in Column Chart is shown only for dataSeries and not for each dataPoint. The legendText property is used to change the text of the dataSeries in the legend.
If you are still facing any issues, please brief us on the issue so that we can understand your exact scenario and help you with an appropriate solution.
—
Adithya Menon
Team CanvasJS