CanvasJS JavaScript StockChart v1.0 Beta Released
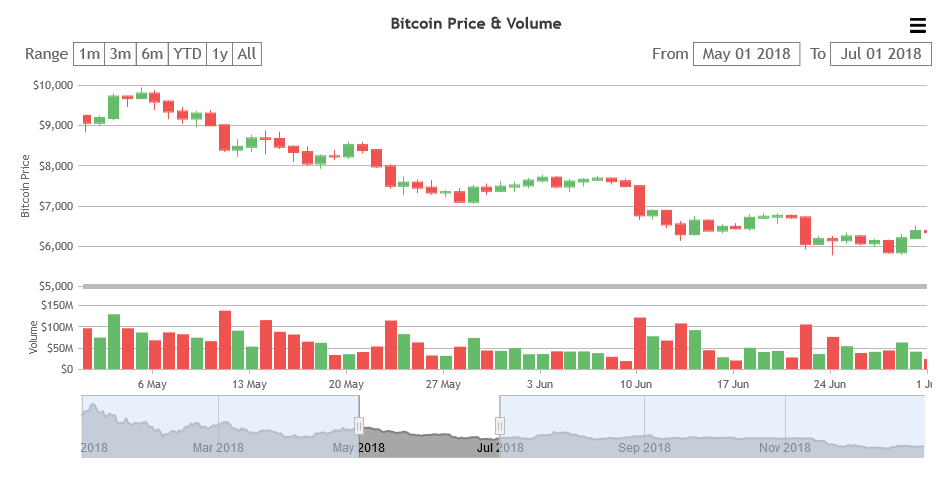
Today, we are excited to announce the release of CanvasJS StockChart v1.0 Beta along with Chart v3.0 Beta. StockChart is an advanced version of our Chart with features like slider, range selector, synchronizing toolTip & crosshair across multiple charts, etc. It also comes with a StockChart jQuery plugin & React Wrapper. Here is a
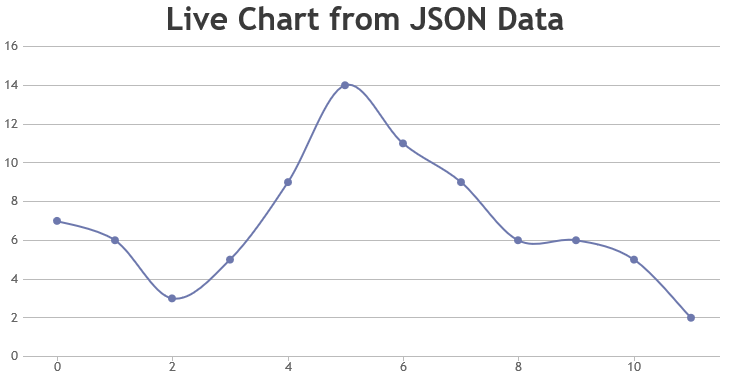
CanvasJS Chart v3.0 Beta Released
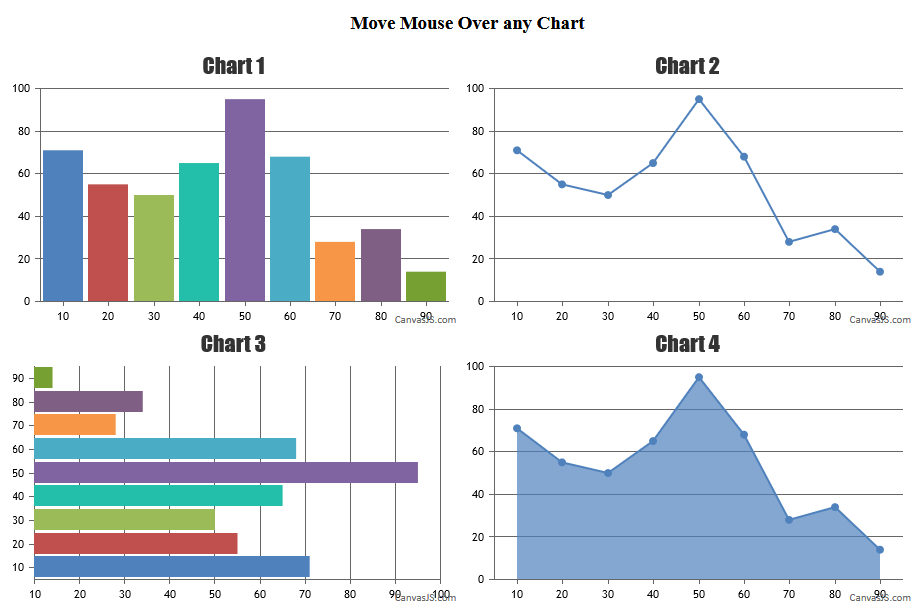
Today we are unwrapping the beta version of CanvasJS v3.0 with some of the major improvements / features like programmatically controlling toolTip & crosshair, API to sync tooltip & crosshair across multiple charts, showing axis labels inside plot-area, etc. Below is a Demo of the new API which allows Synching ToolTip & Crosshair across
CanvasJS Charts v2.3.2GA Released
Today we are releasing v2.3.2 GA with a few bug fixes. Below is a summary of this release. Bug Fixes: In line chart, tooltip was not getting hidden when all datapoints were cleared dynamically. In few cases of dynamic charts, if chart was updated in an inactive tab, data-series used to get hidden
CanvasJS Charts v2.3.1GA Released
Today we are releasing v2.3.1 GA with a few bug fixes. Below is a summary of this release. Bug Fixes: Legends were not being rendered in pie / doughnut charts when verticalAlign was set to center. Library used to throw error, while compiling(minifying) using Webpack in strict mode. Do download the latest
CanvasJS Charts v2.3GA Released
Today we are releasing v2.3 GA with a few bug fixes and enhancements. Below is a summary of this release. Improvements: Improved resource handling in case of dynamic / live charts which reduces memory consumption and also makes updates smoother. Improved events handling in touch screen devices. Bug Fixes: Library used to
CanvasJS v2.2 with React Component Released
Today we are glad to release v2.2 GA with the most awaited React Component for CanvasJS Charts, few improvements and bug-fixes. Below is a summary of this release. A React Component for CanvasJS Charts! It’s time for you to use CanvasJS Charts as a component in your react application and dashboards. You can
CanvasJS v2.1.3GA Released
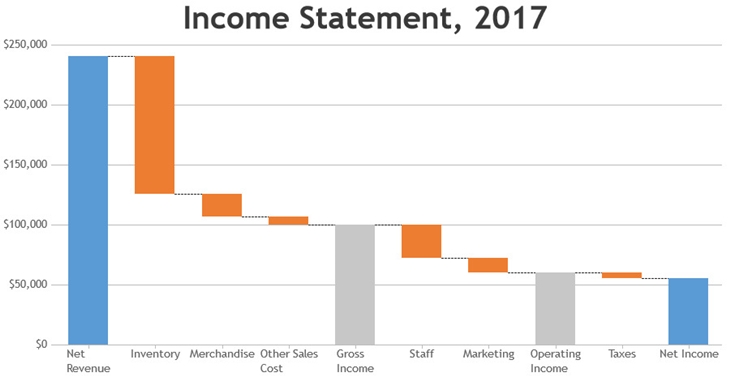
Today we are releasing 2.1.3 GA with a few bug fixes and enhancements. Below is a summary of this release. Bug Fixes: In few cases of waterfall chart when y-values of the falling dataPoint was between -1 and 0, the connecting line between the falling dataPoint and its previous dataPoint was not drawn
CanvasJS v2.1.2GA Released
Today we are releasing 2.1.2 GA with a bug fix. Below is a summary of the release. Bug Fixes: Whenever viewportMaximum was set programmatically and then panned, dataPoints in Stacked Charts outside the set viewportMaximum were not being rendered. We thank Bimal Shah for reporting this issue. Do download the latest
CanvasJS v2.1.1GA Released
Today we are releasing 2.1.1 GA with a few bug fixes. Below is a summary of the release. Bug Fixes: In few cases, a part of stripline label was rendering inside the plotArea even when labelPosition was set to outside. In few cases, stripline label was getting clipped when labelPosition was set to
CanvasJS v2.1GA Released
Today we are releasing 2.1 GA with the most awaited feature, importing CanvasJS as a module to any of the front-end frameworks. You can easily import CanvasJS while working with any front-end frameworks like React, Angular, Vuejs, etc. You can checkout the examples in our angular and react gallery pages. Do download the