Today we are releasing 1.8.1 GA with a few bug fixes. Below is a summary of this release.

Highlights of Version 1.8.1
Below are some of the new features that come as part of v1.8.1
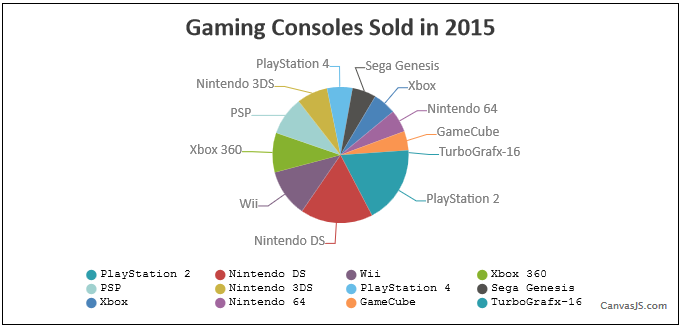
- Auto-Labelling which automatically handles label placement in the best possible way.
- connetNullData which allows you to show discontinuity of dataPoints with dotted lines (also the dash type can be change using nullDataLineDashType) for all Line and Area Chart.
- lineColor and lineDashType which allows you to customize the color and dash-type of line connecting any two dataPoints.
- labelPlacement which allows you to place stripline label inside or outside the plotArea.
- titleWrap which allows you to wrap the axis-title.
- When zooming, selected area indicates whether that region is valid or not – green if valid & red if not valid. It becomes invalid after a certain zooming limit which is auto calculated.
In coming months we’ll be improving chart axis with more power packed features. So do check out these features and let us know your feedback.
Bug Fixes
- While zooming on one chart if we moved to another chart without leaving the mouse (mouseup), selected range was getting affected in the first chart.
- While Zooming if the mouse was released outside the chart, zooming was not getting cancelled. Instead it used to resize selected area when the mouse came back into the chart.
- When toolTip was disabled, selected area (while zooming) was going outside the plotArea.
- All ticks of stripLines were accepting color of last stripline.
- stripLine with startValue and endValue was not accepting labelBackgroundColor when labelPlacement was “inside”.
- In stripLine labelFontColor was taking default color even when color of stripLine was defined and labelFontColor was not.
- Legends were throwing error if dockInsidePlotArea was set to true in certain cases.
- When there were large number (extreme cases) of legends aligned at bottom, the last row was partially getting clipped.
Change in Behavior
- Markers are added to Area Charts by default when when there are less dataPoints and removed automatically when the number of dataPoints increase so that chart doesn’t look cluttered.
- The default legend maxWidth has been increased to chart width from 70% of Chart Width.
Please read v1.8.1 Beta 1 Release, v1.8.1 Beta 2 Release Blog for complete list of features that are available in 1.8.1.
—
Thank You,
Sanjoy Debnath
Team CanvasJS
Leave a Reply