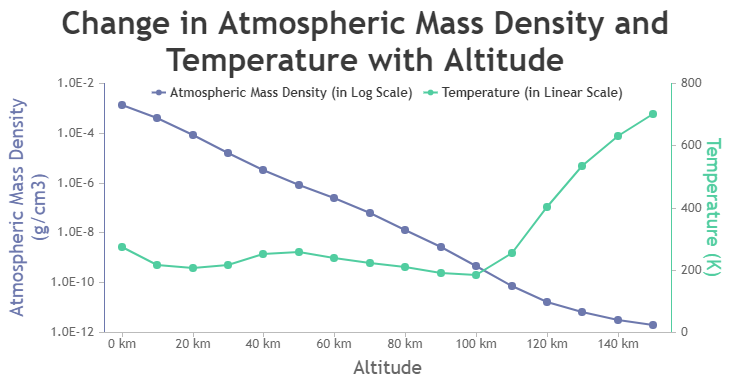
Today, we are very excited to announce that we have added JSP Samples to demo gallery. This release is one of the series of chart gallery releases that we have done over the past weeks and will be continuing. A new chart gallery for Spring MVC is also planned for release very soon.

JSP Gallery contains a large number of chart examples ranging from simple Line, Column, Bar, Pie, Doughnut Charts to Financial Charts. We have also taken special care that the chart examples don’t miss out real-world scenarios like visualizations of data from JSON, CSV, XML, Databases. You can take a look at the Source Code and modify it further to suit your needs. We hope that these comprehensive examples would aid in a seamless integration of CanvasJS in your JSP applications and in case of any issues we are all ears.
We have also taken time to polish and overhaul existing jQuery, ASP.NET MVC and PHP Galleries to complement the new look and feel of revamped CanvasJS 2.0. Please take your time to have a look at the Chart Galleries.
Spring MVC Chart Gallery will be released soon. Stay tuned!
Thank You,
Suyash Singh,
Team CanvasJS
2 Comments
Hi Suyash,
I need help in Trendline chart with dynamic Start Value and End Value. Please help how to pass dynamic Start Value and End Value after calculation y=Mx+b Trendline. I want to assign Calculated Trendline Value to end Value.
Nisha,
Please take a look at this JSFiddle for dynamically adding trend for a dataset. Also refer this forum thread for more info on the same. For any other technical assistance, please feel free to post your queries in Forum.
—
Vishwas R
Team CanvasJS