Login to Ask a Question or Reply
Forum Replies Created by Vishwas R
-
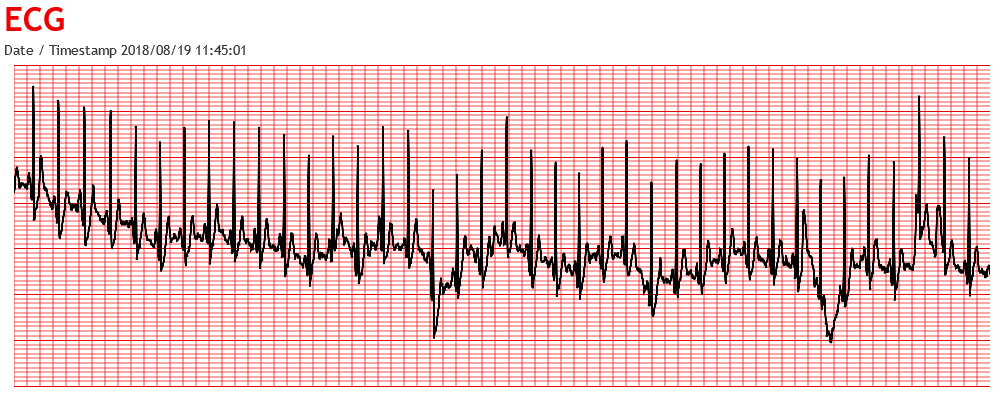
Sorting data before calling chart.render method in updateECG() will work fine in your case. Kindly refer this page for tutorial on array-sorting in JavaScript.
—
Vishwas RKindly download and check ASP.net samples from this link. Refer this section for tutorials on integrating CanvasJS charts to ASP.net MVC application.
—
Vishwas RKiran,
This feature is not available as of now. But by splitting it into multi-series, you can achieve the same. Please Please check this jsfiddle.
—
Vishwas RWe checked the click event. In browser it seems to be working fine but not in webview.
Please refer the following links for more info:
http://stackoverflow.com/questions/24085159/webview-not-catching-javascript-touch-events
http://stackoverflow.com/questions/14846071/touch-events-in-android-webview
http://stackoverflow.com/questions/5271898/javascript-alert-not-working-in-android-webview
http://android-er.blogspot.in/2014/05/android-webview-detect-touch-events.html—
Vishwas RRajendra,
Instead of shifting dps once its length becomes 500, you can just keep shifting y-value keeping x-values constant from 1-500. In this case, x-vlaues remains same and the stripLines stay at same values, just y-values keeps updating/shifting.
—
Vishwas RIt seems data received from database is not parsed properly (not in order/sorted according to x-value) before adding it to chart. Kindly check the data you receive from database.
—
Vishwas RCan you kindly create jsfiddle with the issue, so that we can look into it and help you out.
—
Vishwas RFebruary 2, 2017 at 11:03 am in reply to: Column Chart not Working after downloading from AppStore #14167Ronald,
It seems like when you run your app in emulator, canvasjs.min.js file is loaded from local/server which makes chart to render without any issue. But in app-store, canvajs.min.js may not be loaded (May the file-path is not proper) which is needed to render the chart. Can you kindly verify this once?
—
Vishwas RCan you kindly create JSFiddle reproducing the issue you are facing & share it with us, so that we can look into the code, understand the scenario better and help you out?
Please refer to this documentation page for step-to-step tutorial on creating dynamic charts. Also checkout this forum topic related to ECG graph using CanvasJS chart.
—
Vishwas RFebruary 2, 2017 at 10:45 am in reply to: Stacked bar chart not extending the whole width of the canvas? #14164We are unable to reproduce the issue at our end in Samsung mobile phone. Can you kindly provide us the following information, so that we can look into it further and help you out?
1. Android Version
2. Browser Name and Version—
Vishwas RFebruary 1, 2017 at 12:34 pm in reply to: Stacked bar chart not extending the whole width of the canvas? #14146This is happening as axis is taking space. You can overcome this by setting axis margin to negative value.
—
Vishwas R