Login to Ask a Question or Reply
You must be logged in to post your query.
Home › Forums › Chart Support › Pie chart color not changing
Pie chart color not changing
- This topic has 15 replies, 3 voices, and was last updated 9 years, 6 months ago by
Bivek Singh.
-
January 11, 2017 at 3:52 pm #13966
I am using a canvasjs to make a pie chart. I am using it in my custom code where I am getting the response from the server in an xml file and then I am using it to fill the chart values. My problem is that I am not able to change the colour of the chart meaning even for different labels the colour remains the same for the whole pie chart.
I used debugger also where it the value for colour is changing but still I am not able to resolve it.
color: scopes.chart_color_value[i]I am using an another configuration file where I am storing colour values.
Here is my custom code
$scope.loadChartValue = function (data, scopes) {
    scopes.data_id = [];
    scopes.legend_text = "";
    scopes.inner_chart_data = [];

    for (var i = 0; i <= data.length; i++) {
        var arrayvalue = data[0].data[i]._attr
        if (existsInArray(scopes.data_id, arrayvalue.label._value) == false) {
            scopes.data_id.push(arrayvalue.label._value);
        }
    }
        scopes.inner_chart_data = [];
        var i=1;
        for (var j = 0; j < data[0].data.length; j++) {
            scopes.inner_chart_data.push({ label: data[0].data[j]._attr.label._value, y: data[0].data[j]._attr.value._value });

        scopes.dataset.push(
                   {
                       type: "pie",

                       markerType: "circle",
                       markerSize: scopes.markersize,
                       color: scopes.chart_color_value[i],
                       showInLegend: false,
                       name: scopes.legend_text,
                       dataPoints: scopes.inner_chart_data
                   }
           );
           i++;
        }

}
I dont know how to upload a pic either I have uploaded
-
This topic was modified 9 years, 6 months ago by
shv22.
January 11, 2017 at 4:50 pm #13969If I am using the same code which I use for line it will produce two doughnut chart instead of one. But why I am not getting
$scope.loadChartValue = function (data, scopes) {
scopes.data_id = [];
scopes.legend_text = “”;
scopes.inner_chart_data = [];for (var i = 0; i <= data.length; i++) {
var arrayvalue = data[0].data[i]._attr;
if (existsInArray(scopes.data_id, arrayvalue.label._value) == false) {
scopes.data_id.push(arrayvalue.label._value);}
}
for (var i = 0; i < scopes.data_id.length; i++) {
scopes.inner_chart_data = [];
for (var j = 0; j <= data.length; j++) {
if (data[0].data[j]._attr.label._value == scopes.data_id[i]) {scopes.inner_chart_data.push({ label: data[0].data[j]._attr.label._value, y: data[0].data[j]._attr.value._value });
scopes.legend_text = data[0].data[j]._attr.label._value;
}
}
scopes.dataset.push(
{
type: “doughnut”,markerType: “circle”,
markerSize: scopes.markersize,
color: scopes.chart_color_value[i],
showInLegend: true,
name: scopes.legend_text,
legendText: scopes.legend_text,
dataPoints: scopes.inner_chart_data
}
);
}
}January 12, 2017 at 11:10 am #13977You’re setting the color of entire dataSeries. That’s why whole pie chart is shown in single color.
color: scopes.chart_color_value[i],Remove above line from scopes.dataset.push() and add it inside scopes.inner_chart_data.push();
for (var j = 0; j < data[0].data.length; j++) {
	scopes.inner_chart_data.push({ label: data[0].data[j]._attr.label._value, color: scopes.chart_color_value[j],y:  data[0].data[j]._attr.value._value });
}
scopes.dataset.push({
  type: "pie",
  markerType: "circle",
  markerSize: scopes.markersize,
  showInLegend: false,
  name: scopes.legend_text,
  dataPoints: scopes.inner_chart_data
});
For you second query, doughnut chart is not multi series chart like line chart. That’s why you don’t get 2 charts.
January 12, 2017 at 11:14 am #13978Thanks, I got that after posting here…. I was having pie chart inside a doughnut chart but only doughnut chart is I can see. I have set backgroundColor as transparent but still no use… can you please tell me if something I am missing here?
January 12, 2017 at 12:32 pm #13979I have figured out how to make pie chart inside doughnut but pie chart is small how can I make it big. Here also I have posted my query http://stackoverflow.com/questions/41607486/make-pie-chart-bigger-without-affecting-doughnut-chart/41607600?noredirect=1#comment70417678_41607600
-
This reply was modified 9 years, 6 months ago by
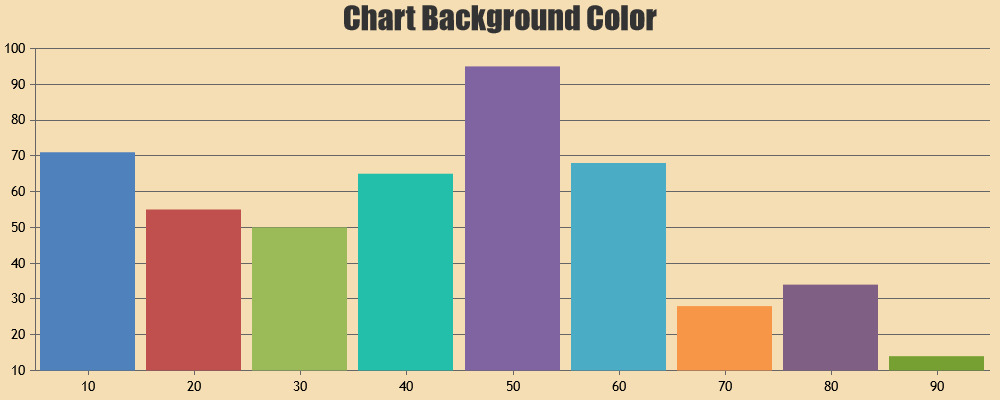
January 13, 2017 at 10:16 am #13988You can use backgroundColor property to change chart background-color, which defaults to white.
Regarding the second query, you can increase the width and height (which is set to 78px and 100px) and change left/top accordingly so that pie is positioned properly.
—
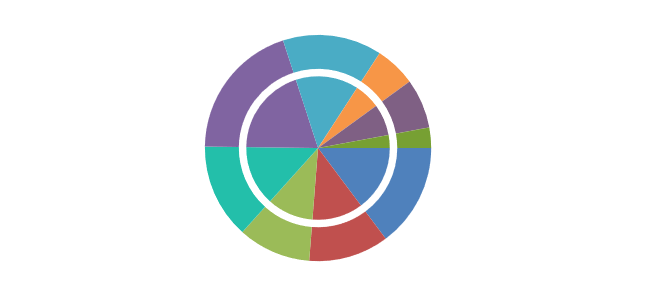
Vishwas RJanuary 13, 2017 at 11:39 am #13989Hi, Vishwas thanks for your response. I did exactly the same i.e., increasing height and width but the problem is when I do that the div of inside pie chart overlaps with the inner circle of doughnut which occurs in doughnut having a white space. I changed the background-color to transparent then also I facing this issue…
I have updated my pic here (See the second one) where I am highlighting the same problem. Waiting for your response. Uploaded my pic here
January 13, 2017 at 6:46 pm #13992You can set chart backgroundColor to “transparent” instead of setting it to div. Please check this working fiddle.
—
Vishwas RJanuary 13, 2017 at 7:58 pm #13993Hi, I have tried setting the same in my pie chart like you suggested like
This is from my code here I applied backgroundColor propertyvar chart = new CanvasJS.Chart(id,
{
backgroundColor: “transparent”,but still white space is there. Any suggestion?
January 14, 2017 at 6:09 pm #13998January 17, 2017 at 10:08 am #14007Hi sorry for the late response…I have done the same thing the fiddle it is working there but when I reusing the same in the code as a plugin and creating chart there it seems to fail. Although, if I change colour there from transparent to black or something else it is working fine…so meaning only transparent is looking like white…why I don’t understand
January 17, 2017 at 11:47 am #14011Hi thank you for your help. I have figured out what I was doing wrong.
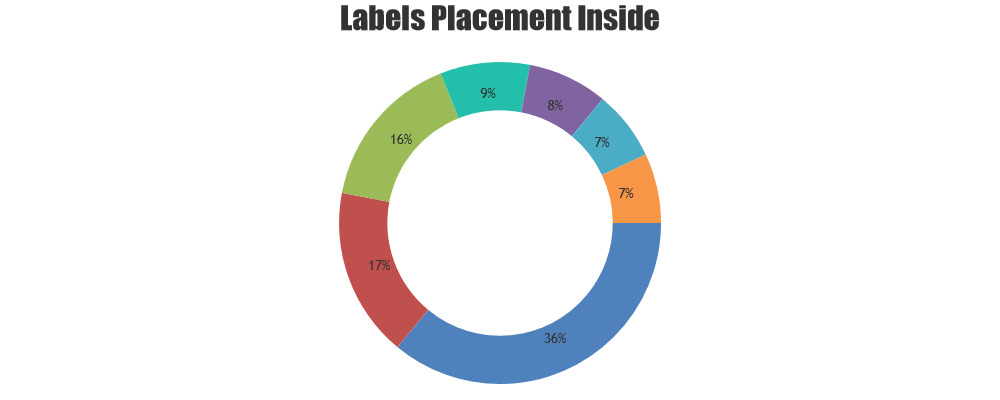
January 17, 2017 at 12:43 pm #14012Just one more query,
here I want to place the Label inside the Pie chart and doughnut chart but I am not able to do. Although, I am using the property indexLabelPlacement: “inside”, still it is coming out.
For Pie chart I am not able to see what it is.
Note: Yellow color label is of pie and the Black color label is of Doughnut.
January 17, 2017 at 5:41 pm #14013indexLabelPlacement: “inside” seems to be working fine. Please check this JSFiddle. If you are still facing issue, create a JSFiddle with the issue so that we can look into it and help you out.
—
Vishwas RJanuary 17, 2017 at 5:50 pm #14014 -
This topic was modified 9 years, 6 months ago by
You must be logged in to reply to this topic.