Login to Ask a Question or Reply
You must be logged in to post your query.
Home › Forums › Chart Support › x-axis labels issue
x-axis labels issue
- This topic has 1 reply, 2 voices, and was last updated 7 years, 9 months ago by
Vishwas R.
-
January 30, 2017 at 7:47 pm #14122
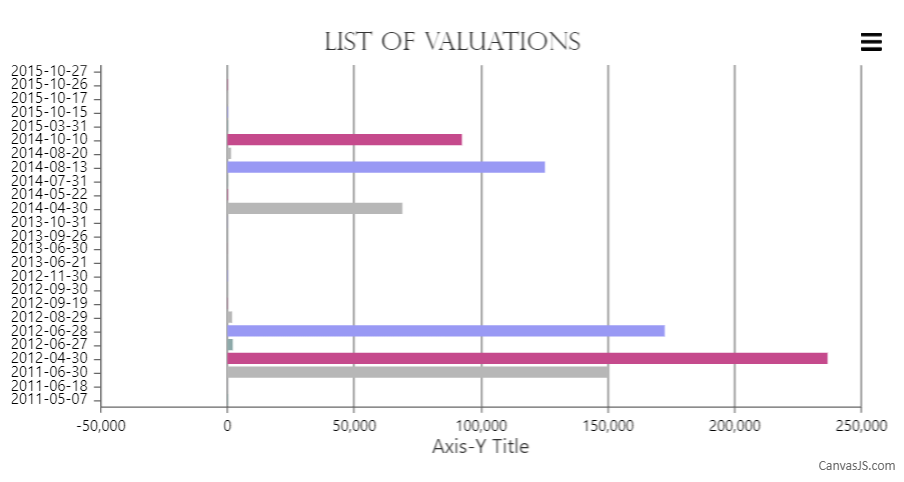
Whenever there is more than a certain number of x-axis (or in horizontal bars, y-axis) labels, canvasjs seems to randomly select a few to include an omits the others. This can look quite ugly as in the attached example. Is there a way to force canvasjs to include all labels?
<!DOCTYPE HTML>
<html>
<head>
<script type=”text/javascript”>
window.onload = function () {
CanvasJS.addColorSet(“main1”,
[//colorSet Array
“#8DA9A9″,”#9999F4″,”#B7B7B7″,”#C54A8C”
]);var chart = new CanvasJS.Chart(“chartContainer”,
{
toolTip:{
fontFamily: “Segoe UI”,
fontSize: 12,
fontStyle: “normal”
},animationEnabled: true,
zoomEnabled: true,
zoomType: “xy”,
colorSet:”main1″,
title:{
text: “List of valuations”,
fontFamily: “Perpetua Titling MT”,
fontSize: 20
},
exportEnabled: true,
axisX: {
labelFontFamily: “Segoe UI”,
labelFontSize: 12,
titleFontFamily: “Segoe UI”,
titleFontSize: 16,
},
axisY: {
title: “asdf”,
labelFontFamily: “Segoe UI”,
labelFontSize: 12,
titleFontFamily: “Segoe UI”,
titleFontSize: 16,
},dataPointMaxWidth: 25,
data: [
{
type: “bar”,
indexLabelFontFamily: “Segoe UI”,
indexLabelFontSize: 12,
dataPoints: [
{y:258.0,label: “2011-05-07”},
{y:28.30,label: “2011-06-18”},
{y:150000.0,label: “2011-06-30”},
{y:236750.0,label: “2012-04-30”},
{y:2082.73,label: “2012-06-27”},
{y:172500.0,label: “2012-06-28”},
{y:1823.65,label: “2012-08-29”},
{y:108.94,label: “2012-09-19”},
{y:-35.0,label: “2012-09-30”},
{y:208.65,label: “2012-11-30”},
{y:56.95,label: “2013-06-21”},
{y:39.96,label: “2013-06-30”},
{y:39.99,label: “2013-09-26”},
{y:72.69,label: “2013-10-31”},
{y:69000.0,label: “2014-04-30”},
{y:229.0,label: “2014-05-22”},
{y:168.94,label: “2014-07-31”},
{y:125250.0,label: “2014-08-13”},
{y:1404.84,label: “2014-08-20”},
{y:92500.0,label: “2014-10-10”},
{y:289.99,label: “2015-03-31”},
{y:270.0,label: “2015-10-15”},
{y:229.0,label: “2015-10-17”},
{y:169.96,label: “2015-10-26”},
{y:43.99,label: “2015-10-27″}
]
}
]
});
chart.render();
}
</script>
<script src=”canvasjs.min.js”></script>
<title>List of valuations</title>
</head>
<body>
<div id=”chartContainer” style=”height: 100%; width: 100%;”></div>
</body>
</html>January 31, 2017 at 9:40 am #14127@Vlatka,
As per the code snippet shared above, we can observe that there are a lot of labels with bigger texts because of which some of the axis labels are skipped to avoid overlapping. This can be customized to show all the labels by setting axisX interval property as 1. Code snippet below shows how you can do the same:
axisX: {
    interval: 1
 }
Please take a look at this JSFiddle for a working example with sample code.

—
Vishwas R
Team CanvasJS
You must be logged in to reply to this topic.