Login to Ask a Question or Reply
Forum Replies Created by Vishwas R
-
Austin,
Glad it’s working. Thanks for letting us know.
—
Vishwas R
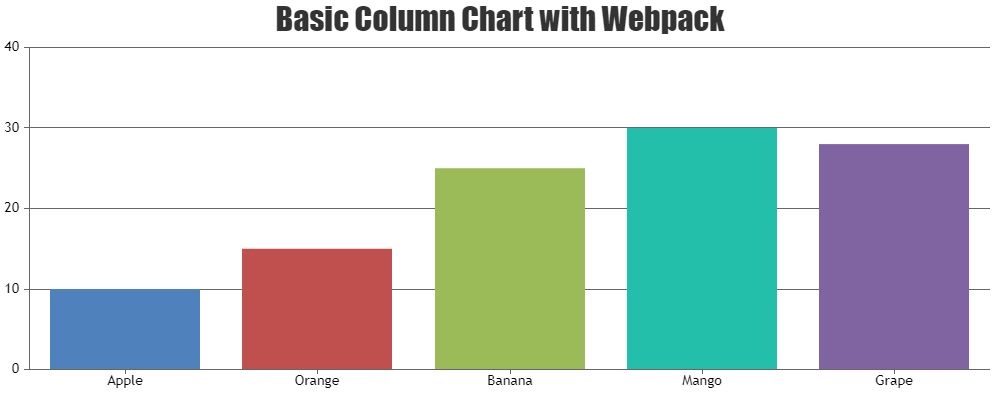
Team CanvasJSDatapoint y-value should be number, but in your case its string. Converting string values to number before assigning them to “y” should work fine in your case.
dps.push({label: item.Name, y: Number(item.Total) });—
Vishwas R
Team CanvasJSWe have fixed the issue and here is an internal build for the same. Kindly download the fixed version and let us know your feedback.
—
Vishwas R
Team CanvasJSIntegral multiple of interval means if interval is 10, ticks will be shown at every values that are multiples of 10 like -30,-20,-10,0,10,20,30 etc irrespective of the minimum and maximum set. If minimum/maximum set is integral multiple of the interval, tick will be shown at minimum/maximum as-well, else it won’t be shown.
—
Vishwas R
Team CanvasJSTo show tick/value at minimum and maximum, minimum and maximum should be integral multiples of interval. i.e. tick/value will appear only at y-values that are integral multiples of the interval.
—
Vishwas R
Team CanvasJSBecause of multiple X / Y axis support, all axis parameters in events like rangeChanging / rangeChanged have been changed to array from object (Since v1.8.5), refer this release-post for more info. Changing e.axisX to e.axisX[0] should work fine in your case. Please check this updated jsfiddle.
We had missed out updating this jsfiddle. Thanks for bringing it to our notice, we have updated the jsfiddle accordingly.
—
Vishwas.RTargaryen,
As documented in MDN,
Given a date string of “March 7, 2014”, parse() assumes a local time zone, but given an ISO format such as “2014-03-07” it will assume a time zone of UTC (ES5 and ECMAScript 2015). Therefore Date objects produced using those strings may represent different moments in time depending on the version of ECMAScript supported unless the system is set with a local time zone of UTC. This means that two date strings that appear equivalent may result in two different values depending on the format of the string that is being converted.Please check this stackoverflow thread for more info. You can solve it either as mentioned in stackoverflow or by changing the date-format as shown in this jsfiddle.
—
Vishwas R
Team CanvasJSEmeric,
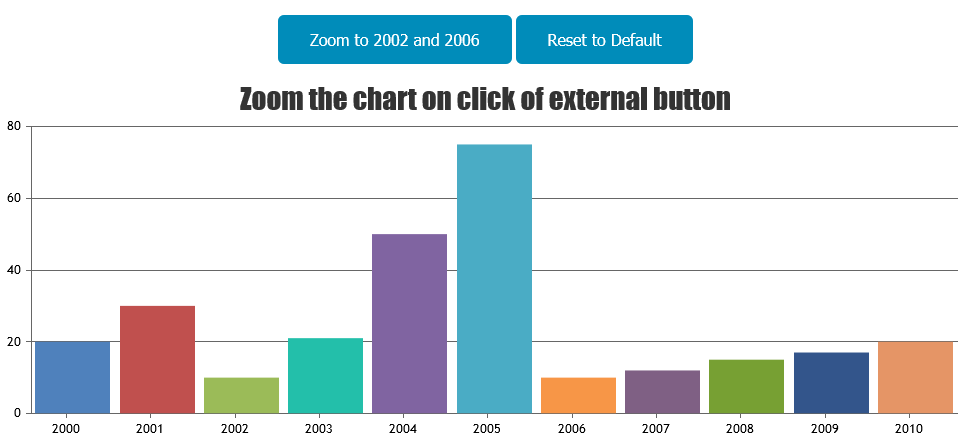
You can programmatically zoom into certain region by setting viewportMinimum and viewportMaximum. If you like to set zoom into certain region after clicking the button, you can do so by changing viewportMinimum & viewportMaximum on clicking the button. Below is the code-snippet for the same.
document.getElementById("zoomBtn").addEventListener("click", function(){
  chart.axisX[0].set("viewportMinimum", new Date(2002, 01, 01), false);
  chart.axisX[0].set("viewportMaximum", new Date(2006, 01, 01));
});
Please take a look at this JSFiddle for complete code.
Also take a look at this jsfiddle, where viewportMinimum and viewportMaximum are changed based on dropdown options.
—
Vishwas R
Team CanvasJSJune 15, 2017 at 9:29 am in reply to: how to get chart.axisX[0].convertValueToPixel with Date axis? #15311You can pass x-value in timestamp (either by passing timestamp in milliseconds directly or using getTime()) to convertValueToPixel in order to get the pixel coordinate of a given value over dateTime axis.
Please check this jsfiddle.
—
Vishwas R
Team CanvasJSYou can control number of labels by setting interval property. Please check this updated JSFiddle.
—
Vishwas R
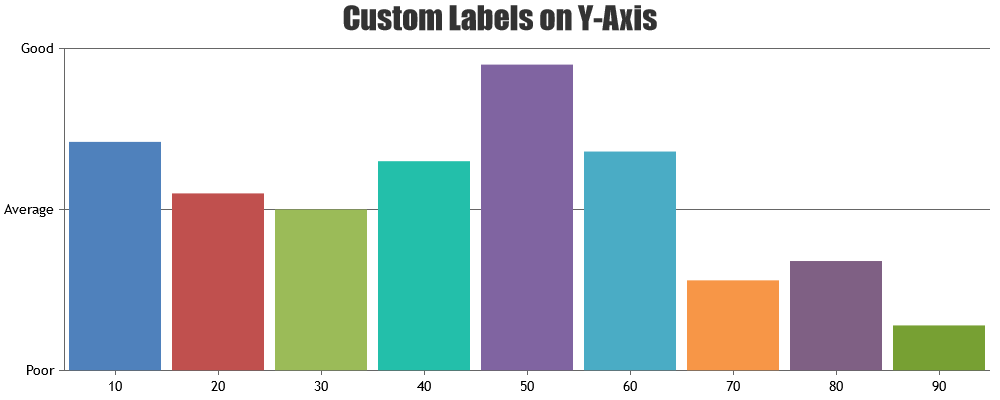
Team CanvasJSIt seems like you are defining labelFormatter in axisX instead of axisY. Adding labelFormatter to axisY should work fine in your case.
Please take a look at this JSFiddle for working code.
—
Vishwas R
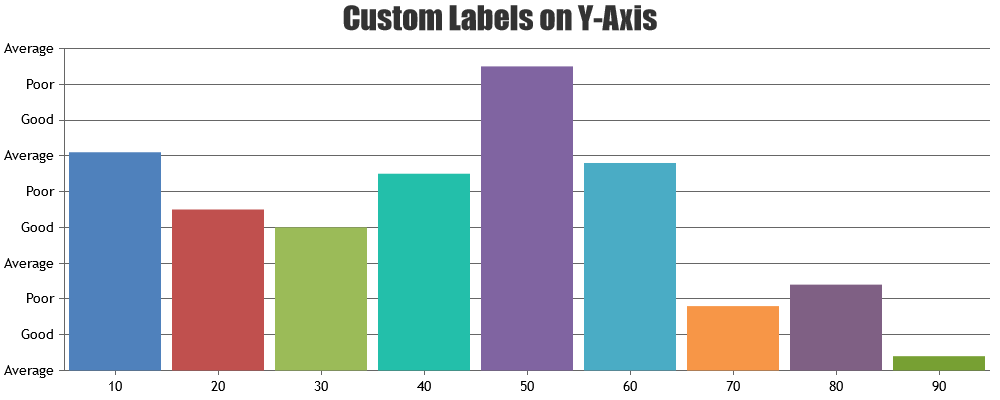
Team CanvasJSMay 12, 2017 at 10:00 am in reply to: Grid line at every 1 point and Y axis label at every 5 point #15093You can achieve this by using interval along with labelFormatter. Please check this jsfiddle.
—
Vishwas R
Team CanvasJSHi,
You can set dataPoint.color in rgba to achieve this. Please check this jsfiddle.
—
Vishwas R
Team CanvasJS