Login to Ask a Question or Reply
Forum Replies Created by Vishwas R
-
You can add use labelFormatter to achieve this. Please check this jsfiddle.
—
Vishwas R
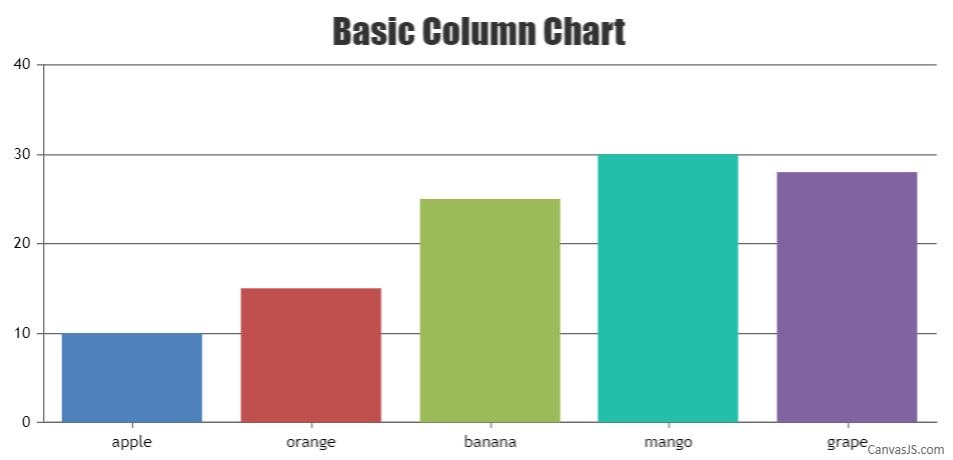
Team CanvasJSYou can set color and lineColor properties to all the dataPoints which are to be distinct. Please check this jsfiddle.
Also you can use stripLines on axisX to show the distinction.
—
Vishwas R
Team CanvasJSFor security reasons, browsers restrict cross-origin requests. JSONP allows you to sidestep the cross-origin requests. Please refer JSONP for more info.
You can also take a look at this jsFiddle for an example on JSONP.
—
Vishwas R
Team CanvasJSJustin,
You can use xValueFormatString to format x-values that appear on toolTip or indexLabels.
—
Vishwas R
Team CanvasJS[UPDATE]
We have released React Component for Charts using which you can build charts in react way. Please refer to this blog post for release note.
Adding type=”text/babel” to the src attribute of script tag should work fine. Please refer this stackoverflow thread for more information.
If you are still facing issue, kindly create sample project reproducing the issue you are facing and share with us over Google-Drive or Onedrive so that we can run it locally to understand the scenario better and help you out.
Also please take a look at this JSFiddle for an example on rendering Column Chart using ReactJS.
—
Vishwas R
Team CanvasJS-
This reply was modified 5 years ago by
Vishwas R.
Praveen,
We don’t have plugin architecture within the product as of now. However you can add custom DOM elements on top of chart and customize it the way you want. Please take a look at this jsfiddle. Also refer Position Image over Chart for tutorial on positioning DOM on chart.
—
Vishwas R
Team CanvasJSYou can render chart with data from html-table by reading entire column and by parsing it to the format accepted by CanvasJS.
Please take a look at this jsfiddle.
—
Vishwas R
Team CanvasJSApplying custom CSS to indexLabel is not available as of now, but you can customize toolTip either by using contentFormatter or by over-riding toolTip class as shown in this jsfiddle.
In bar/column charts, indexLabels are placed inside or outside based on the available space. You can set indexLabelPlacement in dataSeries level to outside so that indexLabels are shown outside the bar.
—
Vishwas R
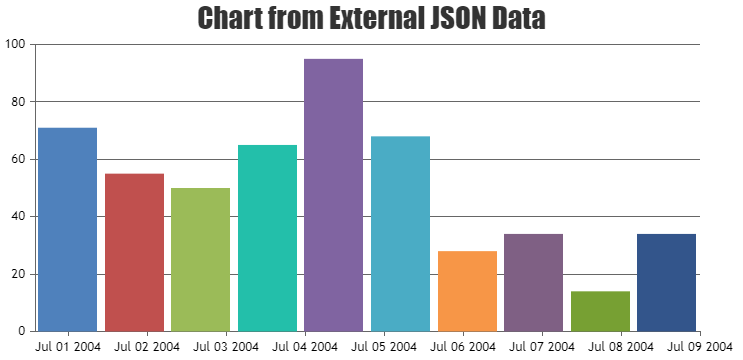
Team CanvasJSOctober 16, 2017 at 10:49 am in reply to: Dynamically build a linear chart from JSON with date? #17310Please refer Tutorial on Creating Charts from JSON Data & AJAX.
The JSON data needs to parsed before passing it to chart-options. Check out the below code snippet for the same.
$.getJSON("https://api.npoint.io/6be170cb804361d314e3", function(chartData) {
	for(var i = 0; i < chartData.length; i++){
  	dps.push({ x: new Date(chartData[i].x), y: chartData[i].y});
  }
	chart = new CanvasJS.Chart("wtChart", {
  	title: {
    	text: "Chart from External JSON Data"
    },
    data: [
      {
        type: "column",
        dataPoints: dps
      }
    ]
  });
  chart.render();
});
Please check this JSFiddle for complete code.
—
Vishwas R
Team CanvasJSSorry for the inconvenience. We are looking into the issue. Meanwhile you can over-ride CSS as shown in this jsfiddle.
—
Vishwas R
Team CanvasJSOctober 3, 2017 at 10:34 am in reply to: Logarithmic line chart draws outside of canvas / out of bounds #17213Tom,
A logarithmic axis can only plot positive values. There is no way to put negative values or zero on a logarithmic axis.
Fundamental: If 10L = Z, then L is the logarithm (base 10) of Z. If L is zero, then Z equals 1.0. If L is a less than 0, then Z is a positive fraction less than 1.0. If L is greater than 0, then Z is greater than 1.0. Note that there no value of L that results in a value of Z that is zero or negative. Logarithms are simply not defined for zero or negative numbers.
—
Vishwas R
Team CanvasJSSeptember 11, 2017 at 10:10 am in reply to: How to display chart as a static image (png, jpg) #16009JavaScript does not have access to the computer’s file system, please refer this stackoverflow thread for more information on the same. Either you can render chart as-such without interactivity or store base64 image globally and replace chart with image with stored base64 image data as source to show static image in a webpage.
—
Vishwas R
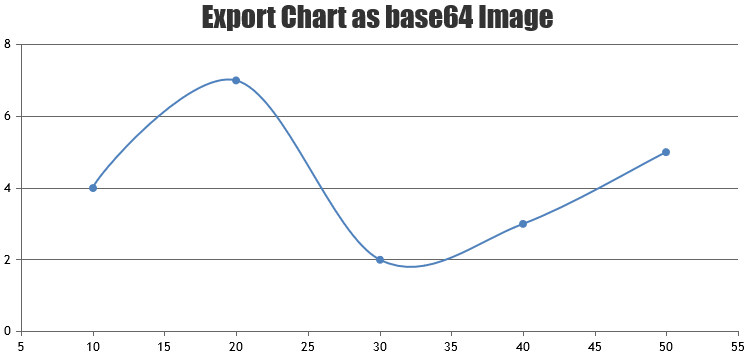
Team CanvasJSYou can get base64 image data of a canvas by using toDataURL. As CanvasJS charts are rendered on canvas, you can use toDataURL on chart to get base64 image data of the chart. Passing base64 data as source of image should work fine in your case. Please find the code-snippet below
var base64Image = chart.canvas.toDataURL();
document.getElementById('chartContainer').style.display = 'none';
document.getElementById('chartImage').src = base64Image;
Please check this JSFiddle for an example on the same.
—
Vishwas R
Team CanvasJS -
This reply was modified 5 years ago by