Login to Ask a Question or Reply
Forum Replies Created by Vishwas R
-
Thanks for bringing it to our notice. You were facing the issue due to trailing comma in chart-options
data: data, // random generator below. Removing trailing comma should work fine in your case. We have updated the code in docs, please try with latest code or try removing trailing commadata: data // random generator below—
Vishwas R
Team CanvasJSYou can scale-up or scale-down the chart before exporting using exportChart method and reset it back soon after exporting. Please take a look at this jsfiddle.
—
Vishwas R
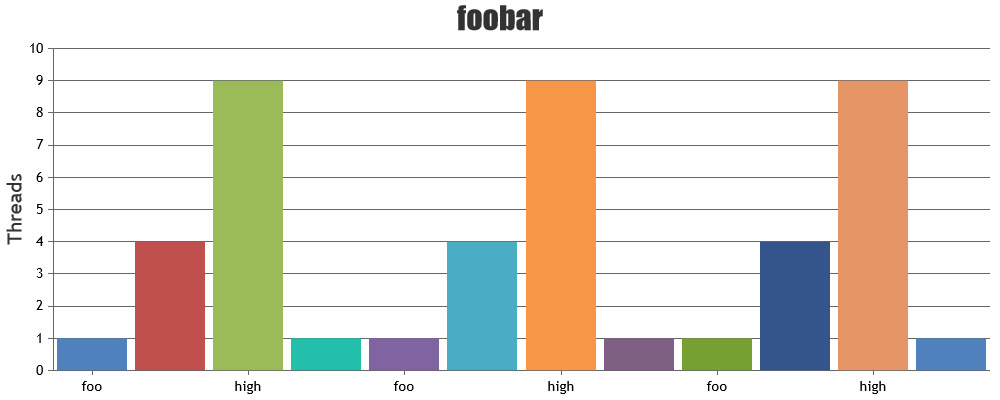
Team CanvasJSYou can have one colorSet within a chart, as of now. However if you are trying to have different colorSets for each dataSeries, you can try setting color in dataPoint level. Please take a look at this jsfiddle.
—
Vishwas R
Team CanvasJSIn JavaScript, date object can be created in 4 ways.
new Date(),new Date(year, month, day, hours, minutes, seconds, milliseconds),new Date(milliseconds),new Date(date string).In your case i.e
new Date(year, month, day), month counts from 0 to 11 i.e. 0 corresponds to January and 11 corresponds to December. Changing the month according to JavaScript date-object should work fine in your case.For different JavaScript date formats please refer this article.
Please take a look at this JSFiddle for a working example with sample code.
—
Vishwas R
Team CanvasJSRyan,
You can position custom DOM wherever you want on the chart with the help of convertValueToPixel and convertPixelToValue methods. Please take a look at this jsfiddle where many custom texts are positioned as indexLabels.
—
Vishwas R
Team CanvasJSui.newTab.index() gives you the index of the current tab, which is 2 in this case. However you are trying to access charts[index] and charts2[index], i.e. charts[2] and charts2[2] which doesn’t exists as the length of both charts and charts2 is 1. Rendering chart1 and chart2 (or charts[0] and charts2[0]) on ‘tabsactivate’ should work fine in this case. Please take a look at this updated jsfiddle.
Still, if you are facing any issue please create a jsfiddle with sample data and share it with us so that we can understand your code better and help you out.
—
Vishwas R
Team CanvasJSRyan
We have just released v2.1.1 with this fix. Please refer to the release blog for more information. Do download the latest version from our download page and let us know your feedback.
—
Vishwas R
Team CanvasJSAnimation happens only on first render of chart, as of now. And the code you have shared seems to be working fine with animation. Please take a look at this jsfiddle.
If this doesn’t fulfill your requirements or if you are facing any other issues, can you please create a jsfiddle and share it with us so that we can understand it better and help you out?
—
Vishwas R
Team CanvasJS@jwk,
You have missed out closing window.onload function because of which its throwing error – please check browser-console. Also we would suggest you to instantiate chart once and update dataPoints on every ajax-request instead of creating new chart on every ajax-request. Please download the updated code and let us know your feedback.
—
Vishwas R
Team CanvasJSWhen all dataSeries are hidden, axisX value-type falls back to default, number. Because of this behavior and as you have set valueFormatString to “DD MMM”, you get to see “DD MMM” on axis instead of date-time.
We will reconsider this behavior in our future releases.
—
Vishwas R
Team CanvasJSDebbie,
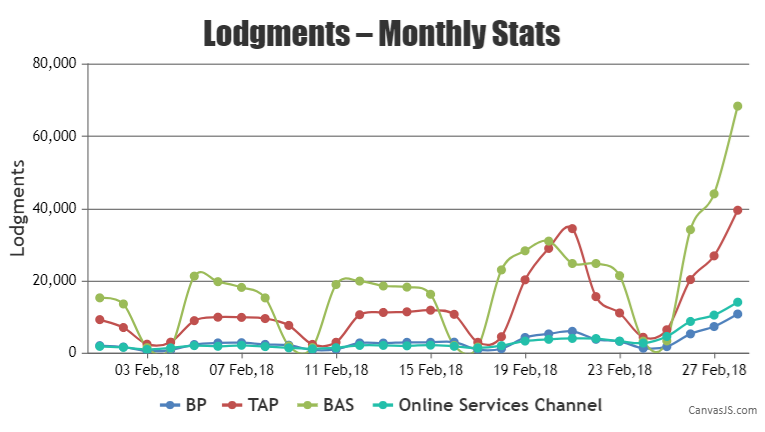
Labels will be rendered at every interval, which is auto-calculated based on width of the chart and the range of x-values. You can set interval to 1, to show labels at every dataPoint in this case. Please take a look at this updated jsfiddle.
—
Vishwas R
Team CanvasJSDebbie,
You can use indexLabels to show y-values as shown in the link shared. Please take a look at this jsfiddle.
—
Vishwas R
Team CanvasJSDebbie,
CanvasJS Chart automatically sets the height and width of the chart according to container’s dimensions. If the values are not set for the container, it takes the default values.
In Bootstrap tabs, since the second tab is not displayed initially, chart takes the default values. To solve this issue, second chart is rendered when the shown.bs.tab event is fired by bootstrap. Please take a look at this jsfiddle.
In jQuery tabs, you need to render chart when a tab becomes active. Please take a look at jQuery Gallery for an example on the same.
Still, if you are facing any issue, kindly create jsfiddle with the issue you are facing and share it with us so that we can look into it and understand better to help you out.
—
Vishwas R
Team CanvasJS