Login to Ask a Question or Reply
You must be logged in to post your query.
Home › Forums › Chart Support › Updating a chart from local CSV file
Updating a chart from local CSV file
- This topic has 10 replies, 2 voices, and was last updated 8 years, 2 months ago by
jwk.
Tagged: csv update
-
April 17, 2018 at 12:59 am #20352
I am trying to get my canvasjs column chart to update from a local csv file. (foobar.csv)
I got the column graph to work. See https://chem2.uaf.edu/facilities/Test/csvtest.htm
but a version containing an updateChart() section fails. See https://chem2.uaf.edu/facilities/Test/csvtest-update.htmI tried to copy the json updateChart() format, but this is not working.
So: How do I code the updateChart() section properly retrieve data from a csv file that might contain changing data?
April 17, 2018 at 10:15 am #20355@jwk,
Can you please check browser console for error
Uncaught SyntaxError: Unexpected token ) - csvtest-update.htm:72. It seems like there is some mismatch of brackets in your code.If you are facing any other issue, kindly create jsfiddle or share static html/php files over onedrive/google-drive so that we can understand your code better and help you out?
—
Vishwas R
Team CanvasJSApril 19, 2018 at 12:12 am #20383I attempted to correct the browser error by removing the “)”, but that just gave a different browser error…
The csvtest.htm:
https://drive.google.com/file/d/15zaOAP9pWG1RJGBdoj_f0MCpQ-PwhHH9/view?usp=sharingThe csvtest-update.htm:
https://drive.google.com/file/d/1qVUNu2pAjbymVej0WciVBaHCeMYImdYD/view?usp=sharingThe foobar.csv :
https://drive.google.com/file/d/1f6D_yexayCKpihbKKNTtvCZSakZIwnCY/view?usp=sharingApril 19, 2018 at 12:57 am #20384Sorry, the hyperlinks for the 2nd and 3rd should be switched.
April 19, 2018 at 10:07 am #20387@jwk,
You have missed out closing window.onload function because of which its throwing error – please check browser-console. Also we would suggest you to instantiate chart once and update dataPoints on every ajax-request instead of creating new chart on every ajax-request. Please download the updated code and let us know your feedback.
—
Vishwas R
Team CanvasJSApril 20, 2018 at 10:53 am #20407Hi Team,
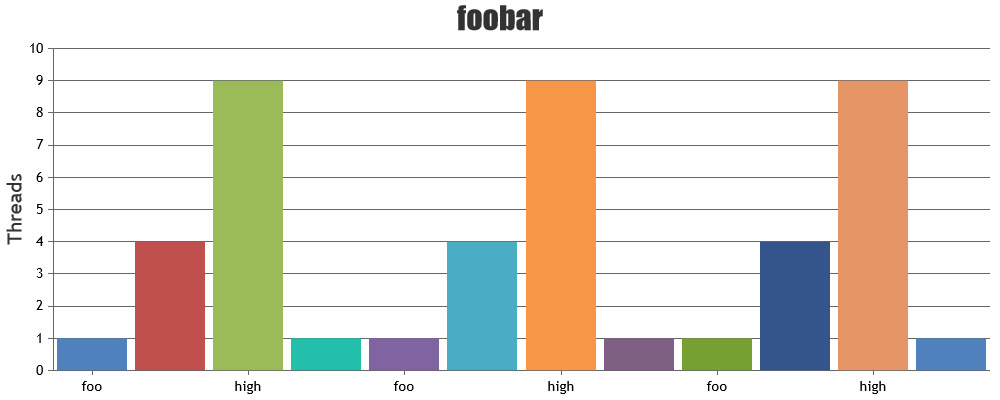
Thank you for the suggested changes to the CVS updating chart! It is now updating. However, the number of columns increases by 4 (which is the number of rows in the CVS file) after each timeout interval..Perhaps the new dataPoints should overwrite the old dataPoints?
John
April 20, 2018 at 11:20 am #20408I created a jsfiddle page for this code:
April 20, 2018 at 10:45 pm #20419Another problem with the suggested code ( https://jsfiddle.net/jwkeller/yy3hdLtz/ ) is that, even at time=0, TWO copies of the CSV file data are plotted.
April 21, 2018 at 3:58 am #20421OK I fixed it. See the above jsfiddle page. All I did was modify the updateChart function with some lines that removed the previous dataPoints using a dataPoints.shift statement.
Once I have this webpage fully functional, I will update this forum with the URL so you can see it in action in the “real world”.
April 23, 2018 at 10:38 am #20431May 1, 2018 at 12:09 am #20509OK it seems to be working. https://chem2.uaf.edu/facilities/WebMO/
Much of the time these servers are not being used. However, anyone can send in a job by logging on as Guest, pwd webmo
Do New Job, Create New Job, Lookup-Import-By Name, tetracyclin, OK.
Click the right arrow (bottom right), choose NWChem (a quantum chemistry package), right-arrow,choose geometry optimization and all the other as defaults, click the advanced tab, change 2 to 8 under Cores, submit the job by clicking the right arrow.The bar graph should register under Rosewill.
Tagged: csv update
You must be logged in to reply to this topic.