Login to Ask a Question or Reply
Forum Replies Created by Vishwas R
-
September 10, 2018 at 10:07 am in reply to: How to hide the secondary graph but not the axis label #22550
Satyabrata,
I request you to share the JSFiddle to try the steps you have mentioned, the reason being – in the JSFiddle that I had shared earlier, once you click Toggle Button, it hides all the dataSeries after which you can’t zoom into any region as there are no dataPoints available to zoom.
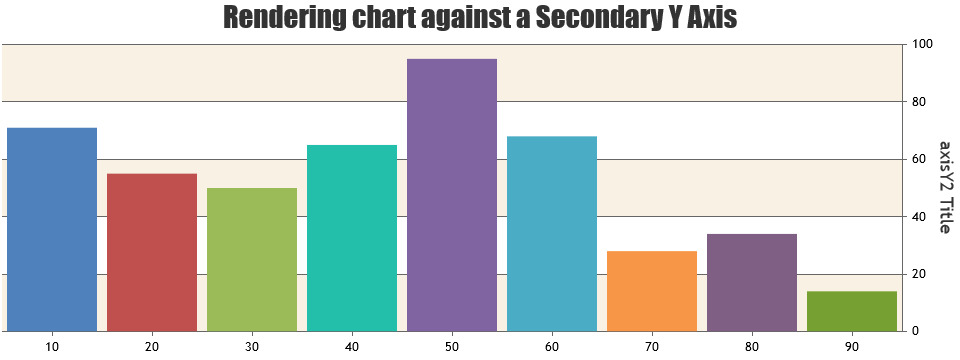
click the toggle button and hide the axisY2 graph but show axisY2 labels.
Do you mean hide dataSeries. Also can you please brief what do you mean by ‘axisY2 graph’ as the entire chart itself is a graph – do you mean the dataSeries that is attached to axisY2.
—
Vishwas R
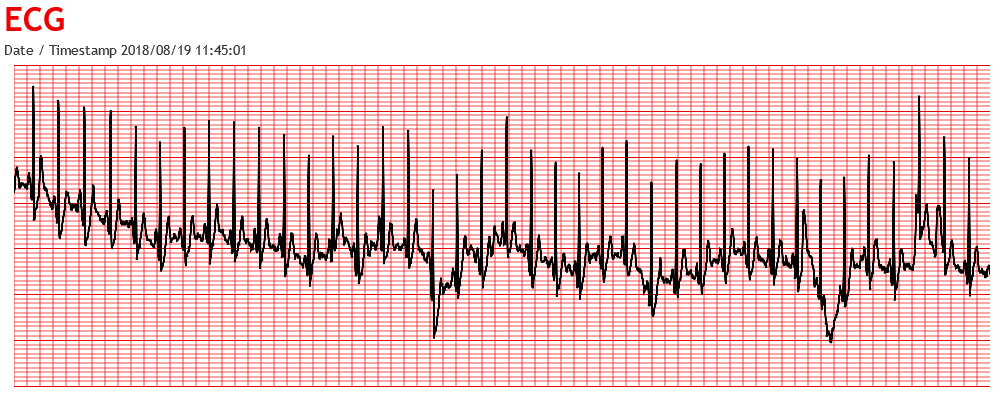
Team CanvasJSThe JSFiddle shared shows how you can achieve ECG graph using CanvasJS charts, which you can further customize as per your requirements. Here is the updated JSFiddle showing 5*5 graph with minor-grids.
You can customize the thickness of gridlines using gridThickness, dataSeries line using lineThickness, stripLine using thickness properties.
—
Vishwas R
Team CanvasJS@leo,
You can customize toolTip content and change its color according to your requirements, please refer documentation on toolTipContent or toolTip.content for more info. Here is the updated JSFiddle with toolTip content being shown with color of corresponding dataSeries color.
One more doubt http://jsfiddle.net/273Lqh3g/103/ in this snippet only some channel values are getting displayed in tooltip.
Datapoint with y-value null will not be shown in toolTip.
—
Vishwas R
Team CanvasJSYou can achieve this by adding stripLines and removing axis-labels and ticks. Please take a look at this JSFiddle. You can further customize the look and feel of the chart by changing chart-options according to your requirements.
—
Vishwas R
Team CanvasJSSeptember 5, 2018 at 9:54 am in reply to: How to hide the secondary graph but not the axis label #22484Satyabrata,
The JSFiddle that you have shared initially seems to have secondary axisY with dataSeries attached to it and toggling dataSeries through legend. To disable toggling (hide / show), you can remove toggleDataSeries function attached on click of legend and you can remove axisY2 by not attaching any dataSeries to it as shown in this updated JSFiddle.
my Secondary Y axis curve (axisY2) is always hidden
It would help us understand your scenario better and help you accordingly if you can create JSFiddle reproducing the issue you are facing or a pictorial representation of your requirements and share it with us.
—
Vishwas R
Team CanvasJSSeptember 4, 2018 at 12:37 pm in reply to: How to hide the secondary graph but not the axis label #22473Satyabrata,
The issue you are facing is due to the interval, minimum and maximum thats being set to axis even when dataSeries are hidden. In this scenario, you may need to reset interval and range of axisY and axisY2 by setting them to null – when the dataSeries becomes visible. Please check out the below code-snippet to do the same.
for(var i = 0; i < chart.data.length; i++) {
  var dataSeries = chart.data[i];
  if (typeof (dataSeries.visible) === "undefined" || dataSeries.visible) {
    chart.options.data[i].visible = false;

    chart.options.axisY.viewportMinimum = chart.axisY[0].viewportMinimum;
    chart.options.axisY.viewportMaximum = chart.axisY[0].viewportMaximum;
    chart.options.axisY.interval = chart.axisY[0].interval;

    chart.options.axisY2.viewportMinimum = chart.axisY2[0].viewportMinimum;
    chart.options.axisY2.viewportMaximum = chart.axisY2[0].viewportMaximum;
    chart.options.axisY2.interval = chart.axisY2[0].interval;
  } else {
    chart.options.data[i].visible = true;

    chart.options.axisY.viewportMinimum = null;
    chart.options.axisY.viewportMaximum = null;
    chart.options.axisY.interval = null;

    chart.options.axisY2.viewportMinimum = null;
    chart.options.axisY2.viewportMaximum = null;
    chart.options.axisY2.interval = null;
  }
}
Please take a look at this updated JSFiddle for working sample.
The code that was shared previously was to help you towards solving your requirements. You can further modify code as per your requirement.
—
Vishwas R
Team CanvasJScan the tooltip be shown only when the mouse is over the datapoint?
Tooltip will be shown only when mouse is hovered or near to the dataPoint, when shared property is not set / set to false (defaults to false). But if shared property is set to true, toolTip is shown when you mouse hover the plotArea i.e. the region where dataPoints are rendered.
In the JSFiddle that you have shared, it seems to be working as briefed above.
—
Vishwas R
Team CanvasJSSeptember 3, 2018 at 4:08 pm in reply to: How to hide the secondary graph but not the axis label #22470When a region is zoomed axisY range gets updated according to the minimum and maximum dataPoints available within the zoomed range. And resetting the range resets the axisY range accordingly. But when a dataSeries is hidden and if you try resetting the zoomed region, it only resets the axes with dataSeries that are visible and not hidden. Resetting in this scenario doesn’t affect the axes with dataSeries that are hidden.
When you zoom in first 4 dataPoints and try to reset it should work fine, but if you zoom in first 4 dataPoints and try to reset after hiding all the dataSeries the axisY range won’t get affected. Because of this behavior axisY2 range doesn’t reset to its initial state. Resetting chart when all the dataSeries are visible should work fine in your case.
—
Vishwas R
Team CanvasJSYou can render chart once the chart-container is loaded. Incase of XPages, you need to create and render charts on onClientLoad event. Also the dataPoints that you pass to the chart should be in the format accepted by CanvasJS, I would suggest you to accept valid JSON from input field. Please download working code from Google-Drive.

—
Vishwas R
Team CanvasJSAugust 30, 2018 at 11:12 pm in reply to: Zero line in line chart for second yaxis without further grid #22453Streifix,
Glad that you found a way to get desired result :)
In future if you find any issue, I would suggest you to share JSFiddle or Pictorial representation of the issue (or your requirements) so that we can understand your scenario better and guide you accordingly.
—
Vishwas R
Team CanvasJSRyan,
Stripline added to second axisX is not displayed as second axisX doesn’t have any range (minimum and maximum of the axis). In case of multiple axes, axis will have it’s range when either dataSeries is attached to the axis or range is defined. You can set range of second axisX to be same as first axisX using get and set methods as shown in this updated JSFiddle.
—
Vishwas R
Team CanvasJSSorry we don’t have definite timeline for next release as we are working on some important features at this point of time.
—
Vishwas R
Team CanvasJSYou can use mouseover of dataPoint level to know over which dataPoint you have hovered the mouse.
—
Vishwas R
Team CanvasJSAugust 28, 2018 at 6:44 pm in reply to: How to hide the secondary graph but not the axis label #22413The issue is happening as minimum and maximum are being updated on hiding and unhiding the dataSeries. I would suggest you to update viewportMinimum and viewportMaximum instead. Please find the code-snippet below.
chart.options.axisY.viewportMinimum = chart.axisY[0].viewportMinimum;
chart.options.axisY.viewportMaximum = chart.axisY[0].viewportMaximum;
chart.options.axisY.interval = chart.axisY[0].interval;

chart.options.axisY2.viewportMinimum = chart.axisY2[0].viewportMinimum;
chart.options.axisY2.viewportMaximum = chart.axisY2[0].viewportMaximum;
chart.options.axisY2.interval = chart.axisY2[0].interval;
Please take a look at this updated JSFiddle for complete code.
—
Vishwas R
Team CanvasJS