Login to Ask a Question or Reply
You must be logged in to post your query.
Home › Forums › Chart Support › How to hide the secondary graph but not the axis label
How to hide the secondary graph but not the axis label
- This topic has 12 replies, 2 voices, and was last updated 7 years, 10 months ago by
Vishwas R.
-
August 27, 2018 at 7:27 pm #22403
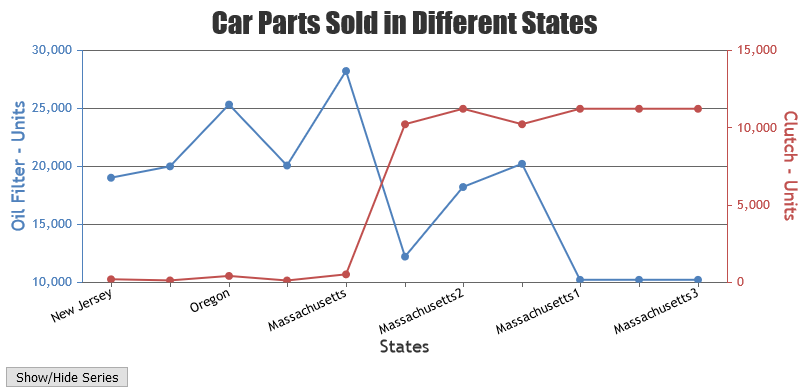
https://jsfiddle.net/opgkjh56/5/
In the above jsfiddle the graph is hidden on click of the legend.
Can I do the same from an outer function without click on legend ?
I do not need legend in my application.August 28, 2018 at 10:03 am #22405Can I do the same from an outer function without click on legend ?
You can hide / unhide dataSeries by toggling visible property of dataSeries. Please take a look at this updated JSFiddle, where all dataSeries are hidden / shown on clicking a button.
I do not need legend in my application.
Legends will be shown when showInLegend is set to true, defaults to false. So legends will not be shown in the chart by setting showInLegend to false or by not setting the property at all.
—
Vishwas R
Team CanvasJSAugust 28, 2018 at 12:22 pm #22410Hi Vishwas,
Still it has issue. When I zoom in the graph selecting first 4 data points from left side and click the ‘Show/Hide Add Series’ button the secondary Yaxis labels are disarranged. It looks like it populated whole Yaxis label values.Regards,
SatyabrataAugust 28, 2018 at 6:44 pm #22413The issue is happening as minimum and maximum are being updated on hiding and unhiding the dataSeries. I would suggest you to update viewportMinimum and viewportMaximum instead. Please find the code-snippet below.
chart.options.axisY.viewportMinimum = chart.axisY[0].viewportMinimum;
chart.options.axisY.viewportMaximum = chart.axisY[0].viewportMaximum;
chart.options.axisY.interval = chart.axisY[0].interval;

chart.options.axisY2.viewportMinimum = chart.axisY2[0].viewportMinimum;
chart.options.axisY2.viewportMaximum = chart.axisY2[0].viewportMaximum;
chart.options.axisY2.interval = chart.axisY2[0].interval;
Please take a look at this updated JSFiddle for complete code.
—
Vishwas R
Team CanvasJSAugust 30, 2018 at 11:32 am #22432Hi Vishwas,
Still It has issue with secondary Yaxis labels. After zoom in for same first 4 data points click on reset button. The secondary Yaxis labels are not resetting to its initial values and graph plotted wrongly.Regards,
SatyabrataSeptember 3, 2018 at 4:08 pm #22470When a region is zoomed axisY range gets updated according to the minimum and maximum dataPoints available within the zoomed range. And resetting the range resets the axisY range accordingly. But when a dataSeries is hidden and if you try resetting the zoomed region, it only resets the axes with dataSeries that are visible and not hidden. Resetting in this scenario doesn’t affect the axes with dataSeries that are hidden.
When you zoom in first 4 dataPoints and try to reset it should work fine, but if you zoom in first 4 dataPoints and try to reset after hiding all the dataSeries the axisY range won’t get affected. Because of this behavior axisY2 range doesn’t reset to its initial state. Resetting chart when all the dataSeries are visible should work fine in your case.
—
Vishwas R
Team CanvasJSSeptember 4, 2018 at 11:58 am #22472Hi Vishwas,
Sorry it is not satisfying my requirements. My requirement is very clear, I need the same behavior when the dataSeries is hidden. My secondary dataSeries will be hidden by default always.Regards,
SatyabrataSeptember 4, 2018 at 12:37 pm #22473Satyabrata,
The issue you are facing is due to the interval, minimum and maximum thats being set to axis even when dataSeries are hidden. In this scenario, you may need to reset interval and range of axisY and axisY2 by setting them to null – when the dataSeries becomes visible. Please check out the below code-snippet to do the same.
for(var i = 0; i < chart.data.length; i++) {
  var dataSeries = chart.data[i];
  if (typeof (dataSeries.visible) === "undefined" || dataSeries.visible) {
    chart.options.data[i].visible = false;

    chart.options.axisY.viewportMinimum = chart.axisY[0].viewportMinimum;
    chart.options.axisY.viewportMaximum = chart.axisY[0].viewportMaximum;
    chart.options.axisY.interval = chart.axisY[0].interval;

    chart.options.axisY2.viewportMinimum = chart.axisY2[0].viewportMinimum;
    chart.options.axisY2.viewportMaximum = chart.axisY2[0].viewportMaximum;
    chart.options.axisY2.interval = chart.axisY2[0].interval;
  } else {
    chart.options.data[i].visible = true;

    chart.options.axisY.viewportMinimum = null;
    chart.options.axisY.viewportMaximum = null;
    chart.options.axisY.interval = null;

    chart.options.axisY2.viewportMinimum = null;
    chart.options.axisY2.viewportMaximum = null;
    chart.options.axisY2.interval = null;
  }
}
Please take a look at this updated JSFiddle for working sample.
The code that was shared previously was to help you towards solving your requirements. You can further modify code as per your requirement.
—
Vishwas R
Team CanvasJSSeptember 4, 2018 at 6:17 pm #22479Hi Vishwas,
I think you did not get my point. I clearly mentioned that my Secondary Y axis curve (axisY2) is always hidden. There is no point to hide/show it. I need it should work for axisY2 when it is hidden. There will be no toggle button to show it again. But the current fix is not working when it is hidden.
Regards,
SatyabrataSeptember 5, 2018 at 9:54 am #22484Satyabrata,
The JSFiddle that you have shared initially seems to have secondary axisY with dataSeries attached to it and toggling dataSeries through legend. To disable toggling (hide / show), you can remove toggleDataSeries function attached on click of legend and you can remove axisY2 by not attaching any dataSeries to it as shown in this updated JSFiddle.
my Secondary Y axis curve (axisY2) is always hidden
It would help us understand your scenario better and help you accordingly if you can create JSFiddle reproducing the issue you are facing or a pictorial representation of your requirements and share it with us.
—
Vishwas R
Team CanvasJSSeptember 5, 2018 at 11:18 am #22485Hi Vishwas,
I am not sure why there is a misunderstanding in clear forward things. All those above things I do not need. At least can you able to make it work when the axisY2 graph is not visible? The axisY2 labels should reset or change according to zoom in region same as AxisY when axisY2 is not visible. Do not create loop on chart.data. Just directly access the chart.data[1] for axisY2 graph and make it hidden on toggle button click and axisY2 labels should change accordingly on reset button click when axisY2 should hidden. But in previous solution axisY2 labels did not reset when the graph is not visible. Do not click the toggle button again to make it visible and reset the axisY2 labels. That is a sure bug. Even it should work in all scenarios.Regards,
SatyabrataSeptember 5, 2018 at 2:11 pm #22487Hi Vishwas,
Steps:
1-> click the toggle button and hide the axisY2 graph but show axisY2 labels.
2-> zoom in first point 4 points, axisY2 labels should change accordingly.
3-> click on reset button. axisY2 labels should reset to initial values.Regards,
SatyabrataSeptember 10, 2018 at 10:07 am #22550Satyabrata,
I request you to share the JSFiddle to try the steps you have mentioned, the reason being – in the JSFiddle that I had shared earlier, once you click Toggle Button, it hides all the dataSeries after which you can’t zoom into any region as there are no dataPoints available to zoom.
click the toggle button and hide the axisY2 graph but show axisY2 labels.
Do you mean hide dataSeries. Also can you please brief what do you mean by ‘axisY2 graph’ as the entire chart itself is a graph – do you mean the dataSeries that is attached to axisY2.
—
Vishwas R
Team CanvasJS
You must be logged in to reply to this topic.