Login to Ask a Question or Reply
Forum Replies Created by Vishwas R
-
December 20, 2018 at 10:27 am in reply to: Reading Exernal data from URL not working in line Graph #23807
Can you kindly share sample project over Google-Drive or Onedrive so that we can run it locally at our end, understand the use-case better and help you out.
—
Vishwas R
Team CanvasJSIn the JSFiddle provided in previous reply,
calculateTrendLinemethod calculates trend-line dynamically based on dataPoints passed to chart, irrespective of source of dataPoints. Please refer this stackexchange thread for more info on calculating trend-line / Y=mx+b.If adding calculateTrendLine method doesn’t work in your case, kindly share sample project with sample database over Google-Drive or Onedrive, so that we can look into your code, understand it better and help you out.
—
Vishwas R
Team CanvasJSDecember 20, 2018 at 10:26 am in reply to: Uncaught TypeError: jQuery.getJSON is not a function #23805Victor,
Kindly make sure you are including jQuery in your project, and not jQuery slim – which excludes AJAX and animation effects modules. Including jQuery instead of slim should work fine in this case. Please refer this to stackoverflow thread for more information.
If you are still facing issue, kindly create a sample project reproducing the issue you are facing & share it with us over Google-Drive or Onedrive so that we can look into your code, understand the scenario better and help you out.
—
Vishwas R
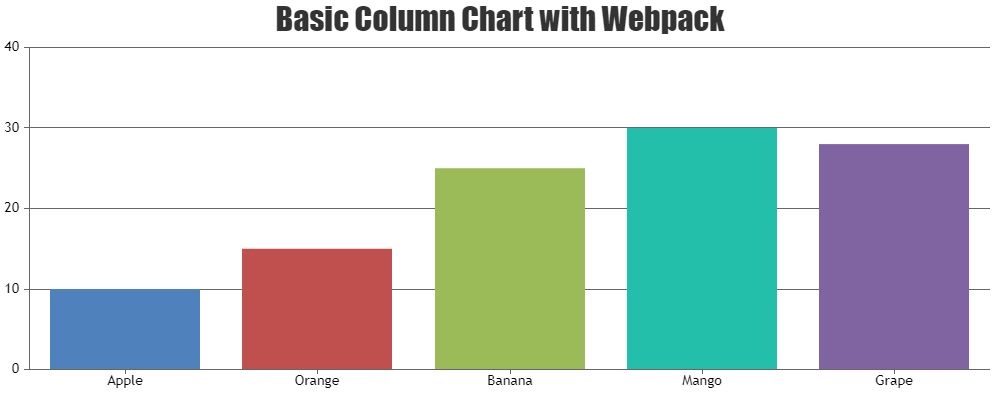
Team CanvasJSDecember 20, 2018 at 10:24 am in reply to: Is there a way to separate the pan and zoom buttons? #23804Apologies for the inconvenience caused. The issue seems to be due to the breaking changes in Webpack that was introduced in v2.2.0-rc.5 since when you can mix require and export whereas you can’t mix import and module.exports. Please take a look at this sample project that works fine with Webpack 2.4.1.
—
Vishwas R
Team CanvasJSThe link shared seems to be working fine. Here is the download link for your reference: https://1drv.ms/u/s!Am6ZJqYg9ZmfgglW57iRB6azpcX_
—
Vishwas R
Team CanvasJSDecember 19, 2018 at 10:25 am in reply to: Reading Exernal data from URL not working in line Graph #23789Please take a look at this sample project on integrating CanvasJS in NodeJS.
—
Vishwas R
Team CanvasJSthat query gives me 5000+ records, divided by 15 minutes in all the records from this year, but the x axis shows me this range
Range of x-axis depends on the dataPoints, if minimum/maximum or viewportMinimum/viewportMaximum are not set. Kindly share JSFiddle with sample data so that we can look into the chart-options you are using, understand the scenario better and help you out.
And when you put the cursor on it, it says “18 Jan 70”, what it means?
Tooltip content is showing 1970 as the timestamp that you are passing to the dataPoints are PHP Timestamp. PHP uses Unix timestamp which is in seconds whereas JavaScript uses milliseconds as timestamp. Converting PHP timestamp to JS timestamp by multiplying PHP timestamp by 1000 should work fine in your case.
—
Vishwas R
Team CanvasJSDo you mean to show gridlines on top of area chart? If so please take a look at this JSFiddle which shows adding striplines at every interval over axisY to show gridlines on top of columns without reducing the opacity of columns.
If not, can you kindly brief your requirements further, so that we can understand it better and help you out?
—
Vishwas R
Team CanvasJSYou can calculate the dataPoints to the trend-line dynamically by calculating slope as explained in this stackexchange thread. Here is the updated JSFiddle.
One More Question: yValue += Math.round(Math.random() * 10 – 5); What is 10 and 5 here? What we are doing in this formula. Sorry I am new to this.
JavaScript random method returns a floating-point, pseudo-random number in the range 0–1 (inclusive of 0, but not 1). With the help of random method, you can generate a random number between two numbers (lets say you need a number between 0 and 100), which is used in the JSFiddle that’s shared with you.
—
Vishwas R
Team CanvasJSIn the JSFiddle that has been shared, y-values are randomly generated using JavaScript random method. With the help of random method, you can generate a random number between two numbers (lets say you need a number between 0 and 100). You can replace dataPoints in this example with your actual dataPoints and it should work fine.
—
Vishwas R
Team CanvasJSDecember 18, 2018 at 11:43 am in reply to: Reading Exernal data from URL not working in line Graph #23771The data that you are getting from the service is in CSV format which you should parse it to the format accepted by CanvasJS before passing to the chart. Please take a look at our documentation on Creating Chart from CSV Data for step by step tutorial on the same.
—
Vishwas R
Team CanvasJSThanks for reporting the issue. Declaring the variable ‘i’ in the getPercentAndTotal method should fix the issue in strict mode. We will fix the same in future releases.
—
Vishwas R
Team CanvasJSThe JSFiddle that you have shared seems to be working fine across browsers including Chrome, Firefox, Opera, Edge and IE. Here is the screenshot of the same.

Can you kindly share the OS details and Browser details like browser name, version, etc so that we can try the same at our end.
—
Vishwas R
Team CanvasJS