Login to Ask a Question or Reply
You must be logged in to post your query.
Home › Forums › Chart Support › Need help with Date time values in XAxis
Need help with Date time values in XAxis
- This topic has 8 replies, 2 voices, and was last updated 7 years, 7 months ago by
hackkpo.
-
December 14, 2018 at 3:41 am #23723
I need to do 4 area charts with the same dataset (from database). In the table the date data is formatted like this = “2018-08-15 20:40:00” and for the Y data is a number value from another column. I figured out how to create the array with the data, and pass it trough json to the script, but I cant find the way to the chart get right the data.
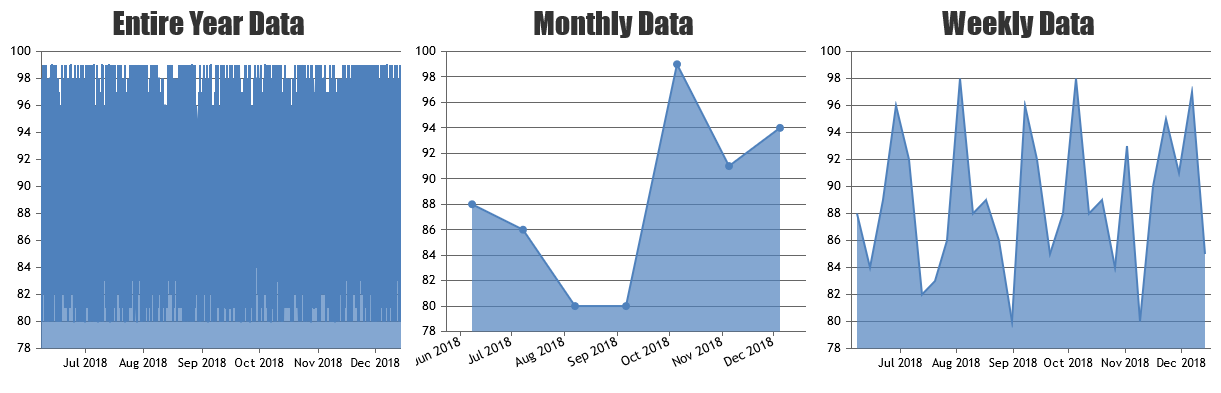
$sql = 'SELECT timestamp, valor
        FROM historial
        WHERE YEAR(timestamp) = YEAR(CURDATE())';
        // echo $sql."<br><br>";
$resYear = mysqli_query($conn, $sql) or die(mysqli_error($conn));

$arrYear = array();

while($datos = mysqli_fetch_array($resYear, MYSQLI_NUM)){
    $arrYear[] =  array("x" => new DateTime($datos[0]), "y" => $datos[1]);
}

<script>
			$(function () {
		            var chart = new CanvasJS.Chart("year-chart", {
					theme: "light2", // "light1", "light2", "dark1", "dark2"
					animationEnabled: true,
					zoomEnabled: true,
					title: {
						text: "Registros del año"
					},
					data: [{
						type: "area",
            xValueType: "dateTime",
						dataPoints: <?php echo json_encode($arrYear, JSON_NUMERIC_CHECK) ?>
					}]
				});
				chart.render();
			});

		</script>
With that solved I have to put that data in one chart visualized through time on year basis; month basis on another, week basis on the third and day basis (like between hours and minutes) on the last one. I dont figure how to do that either.
December 14, 2018 at 3:18 pm #23726You can read data from database, which gives you entire year data and render it in first chart. And for monthly and weekly data, you can filter data from the existing as shown in this Sample Project.
—
Vishwas R
Team CanvasJSDecember 15, 2018 at 4:02 am #23732But my problem is that isn’t rendered correctly, and i don’t know why, look (the pointed char is the result from that code)
PD: I’ll look the shared sample, txs
-
This reply was modified 7 years, 7 months ago by
December 17, 2018 at 11:53 am #23747December 18, 2018 at 5:53 am #23768December 18, 2018 at 11:42 am #23769The JSFiddle that you have shared seems to be working fine across browsers including Chrome, Firefox, Opera, Edge and IE. Here is the screenshot of the same.

Can you kindly share the OS details and Browser details like browser name, version, etc so that we can try the same at our end.
—
Vishwas R
Team CanvasJSDecember 19, 2018 at 2:04 am #23783You’re right! I didn’t notice haha. But how do i understand the chart? I mean, that query gives me 5000+ records, divided by 15 minutes in all the records from this year, but the x axis shows me this range

And when you put the cursor on it, it says “18 Jan 70”, what it means?
December 19, 2018 at 10:24 am #23788that query gives me 5000+ records, divided by 15 minutes in all the records from this year, but the x axis shows me this range
Range of x-axis depends on the dataPoints, if minimum/maximum or viewportMinimum/viewportMaximum are not set. Kindly share JSFiddle with sample data so that we can look into the chart-options you are using, understand the scenario better and help you out.
And when you put the cursor on it, it says “18 Jan 70”, what it means?
Tooltip content is showing 1970 as the timestamp that you are passing to the dataPoints are PHP Timestamp. PHP uses Unix timestamp which is in seconds whereas JavaScript uses milliseconds as timestamp. Converting PHP timestamp to JS timestamp by multiplying PHP timestamp by 1000 should work fine in your case.
—
Vishwas R
Team CanvasJSDecember 25, 2018 at 12:37 am #23847Finally got it working! The minimum and maximum attributes did all the magic, txs for the help Vishwas!
-
This reply was modified 7 years, 7 months ago by
You must be logged in to reply to this topic.