Login to Ask a Question or Reply
Forum Replies Created by Vishwas R
-
December 24, 2020 at 6:20 pm in reply to: How to create x axis value formatting with date ranges #32334
You can define the format of value shown in axis label by setting valueFormatString. To show labels as 10/06/2020, you should be setting valueFormatString to “DD/MM/YYYY’. Please refer documentation for more customization options available.
—
Vishwas R
Team CanvasJSAJAX request is asynchronous – the operation occurs in parallel and the order of completion is not guaranteed. In your case, calling stockChart.render() soon after updating datapoints within AJAX request should work fine. Please take a look at this updated JSFiddle.
Considering this thread as duplicate of stripLines in stockCharts acting weird. Hence closing the same.
—
Vishwas R
Team CanvasJSAJAX request is asynchronous – the operation occurs in parallel and the order of completion is not guaranteed. In your case, calling stockChart.render() soon after updating datapoints within AJAX request should work fine. Please take a look at this updated JSFiddle.
—
Vishwas R
Team CanvasJSDecember 10, 2020 at 6:17 pm in reply to: React pie chart slice not exploding when I implement ‘click’ #32197It seems to be working fine, please take a look at this StackBlitz code for simple demo on the same.
If you are still facing issue, can you kindly create sample project reproducing the issue you are facing and share it with us, so that we can look into the code / chart-options being used, understand the scenario better and help you resolve?
—
Vishwas R
Team CanvasJSYou can get the instance of the chart by passing
onRef = {ref => chart = ref}props to the Chart Component. Later you can callchart.render();. Please refer documentation for more information about CanvasJS React Component & the props available.If you are looking to explode just one slice, you can set exploded property of all the dataPoints to false except the currently clicked slice. Please take a look at this StackBlitz code for an example on the same.
—
Vishwas R
Team CanvasJSRaluca,
In order to update chart, you need to either change chart-options and call render or use set method. In your case, updating dataPoints through chart-options seems to be working fine. Please take a look at this updated stackblitz code.
Considering this as duplicate of Chart update on button click in Angular, hence closing the same.
—
Vishwas R
Team CanvasJSRaluca,
In order to update chart, you need to either change chart-options and call render or use set method. In your case, updating dataPoints through chart-options seems to be working fine. Please take a look at this updated stackblitz code.
—
Vishwas R
Team CanvasJSRaluca,
In order to update chart, you need to either change chart-options and call render or use set method. In your case, updating dataPoints through chart-options seems to be working fine. Please take a look at this updated stackblitz code.
Considering this as duplicate of Chart update on button click in Angular, hence closing the same.
—
Vishwas R
Team CanvasJSAny example for doing Synchronized Line Charts in React?
You can synchronize tooltip between multiple charts by using updated & hidden events, showAtX & hide methods. Please take a look at this Stackblitz demo for an example on the same.
Whenever Line Charts dataSeries are hidden, how to hide its information from toolTip in React?
In you are using toolTipContent in your case, you can set it to null on hiding dataSeries to hide particular dataSeries information from toolTip as shown in this JSFiddle. In case of contentFormatter, checking if the dataSeries is visible works for you. Please take a look at this JSFiddle for an example on the same.
I saw the license how few type, how to define 1 or multiple developer?
One of our representatives from sales team will get in touch with you soon. For more license related queries please contact sales[at]canvasjs[dot]com
—
Vishwas R
Team CanvasJSThe result does not work in this case, ie: pinenuts is empty
Tooltip is showing just name incase of datapoint with label pinenuts because of
if(e.entries[i].dataPoint.y)condition. Checking if the y-value is greater-than or zero should work fine in this case. Please take a look at this updated JSFiddle.In this other simple example, I have duplicate labels where “admin” is missing and “other” is listed twice:
https://jsfiddle.net/pworthing/m3krjcyf/5/A second minor question with the onclick function in the second example. how can I get the value of the inner dataset name value that is clicked. And ultimately the same value that is moused over for the tooltip. I wanted to put a flag next to the data where the mouse is.
You can get the dataSeries name on clicking on a particular dataPoint as
e.dataSeries.name. Also updating name property on clicking datapoint should work fine in this case. Please take a look at this updated JSFiddle.PS: Stacked Bar Charts are plotted when multiple Bar Charts with aligned x values are plotted on same axis. But in the JSFiddles that you have shared, x-values are not used but only labels.
—
Vishwas R
Team CanvasJSYou can show just first 10 datapoints within the viewport by setting viewportMaximum property to 10 (when x-values are 1,2,3,…). If you are looking for showing top-10 (datapoints with highest y-values) to be shown, please take a look at this JSFiddle.
If you are still finding difficulty in achieving what you are looking for, kindly create JSFiddle with your use-case and share it with us so that we can look into the sample data & the chart-options being used, understand the scenario better and help you out.
—
Vishwas R
Team CanvasJSChart renders dataseries in the sequence you pass it in chart-options. Passing dataseries with type column before line should work fine in this case. Please take a look at this updated JSFiddle.
—
Vishwas R
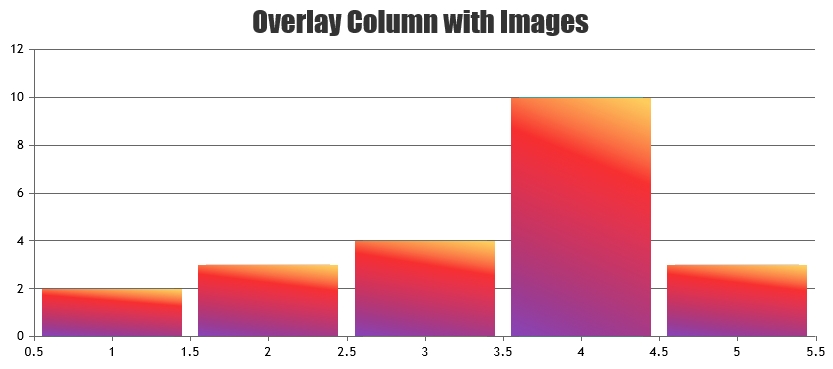
Team CanvasJSYou can position image over column with the help of convertValueToPixel method. Please take a look at this JSFiddle for an example on overlaying image over columns in column chart.
—
Vishwas R
Team CanvasJSYou seem to be passing legend as StockChart options. Legend is an element of chart, hence passing it inside charts of StockChart options should work fine in this case. Please take a look at this updated JSFiddle.
—
Vishwas R
Team CanvasJSNovember 20, 2020 at 6:58 pm in reply to: Regarding taking report using tcpdf in php along with data and pie chart #32009CanvasJS is a JavaScript library which runs on client-side. To embed chart in pdf generated using server-side libraries like tcpdf, mpdf, etc please follow the below steps.
1. Generate the image of chart using headless-browser like PhantomJS. Please refer this sample project for an example on same.
2. Add image generated in previous step to the pdf using TCPDF. Please refer TCPDF documentation for an example on the same.—
Vishwas R
Team CanvasJSs