Login to Ask a Question or Reply
Forum Replies Created by Sunil Urs
-
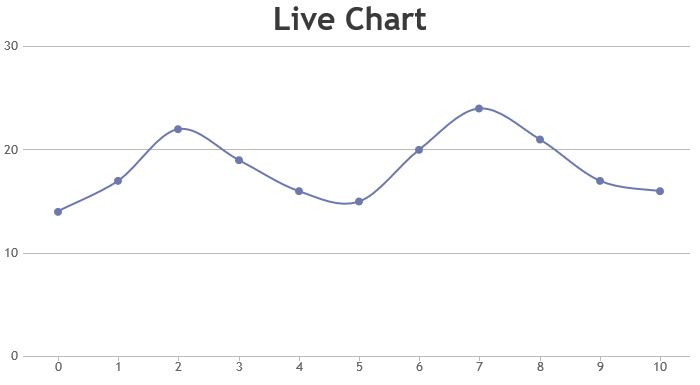
While creating a dynamic chart, to redraw a chart, you will just have to change/add the dataPoints to the dataPoints array and then call chart.render() again.
Please take a look at the code snippet below,
var xVal = dps.length + 1;
var yVal = 100;
var updateInterval = 1000;

var updateChart = function () {


		yVal = yVal +  Math.round(5 + Math.random() *(-5-5));
		dps.push({x: xVal,y: yVal,});

		xVal++;

	chart.render();

};
setInterval(function(){updateChart()}, updateInterval);
Please refer to this documentation page for a step-by-step tutorial on how to create a dynamic chart.

There are two issues in the code
1. “indexLabelPlacement”: “none”, // It should either be “outside” or “inside”.
2. “indexLabel”: “” // you are explicitly setting indexLabel to empty string. Remove this one too.Delete all occurrences of above properties. You can define indexLabel at the series level itself as show below.
"data": [
{
  indexLabel: "{y}",
  yValueFormatString: "#%",
  dataPoints: [.........]
}
]
—
Sunil[Update]
Now we have a Tutorial on Syncing Zoom / Pan across Multiple Charts.
Sorry, this features is not available as of now. But I’ll consider it for a future version.
Please checkout the latest build that supports Retina/HiDPI Displays. It works on IE7/8 too!!
You can write something like
var chart = null;
setTimeout(function(){

chart = [create chart here]
chart.render();

},3000);
//3000 ms delay. Try increasing/decreasing the delay.
Please remember this is not the ideal way to go. Am suggesting this just to confirm if the dimensions of the container are being set very late. If this works, you can instead try adding the chart rendering logic (without delay) at the end of the page (after all the other script tags) so that it runs after all other scripts are done.
—
Sunil UrsCanvasJS basically takes the width and height from its container element. So the most probably issue is that the width/height/position of div element is not set properly when the chart is created. Just to confirm, can you try creating the charts after a couple of seconds of delay after the page load event?

—
Sunil UrsChart clips anything that goes outside of axis’s maximum/minimum. So in cases where markers at the boundaries are getting clipped, here is what I would do.
axisY:{
        maximum: 103,
        lineThickness: 0
      }
This will slightly increase the axis range but will not show any label at the end – which gives an impression that 100 is the maximum range of chart.
—
Sunil UrsSorry about the delay. The patch is coming along with support for Retina Display and IE8-. Though the library itself is ready, website has some glitches with IE8-. So I had to postpone the release. Meanwhile here is an internal build for you.
This build is retina ready and also supports IE8-. Let me know if it worked as expected.
—
Sunil UrsI’ll look into this today. If it can be done quickly I’ll implement it right away.
Hi David,
It is not possible to change the label itself into links. But you can use click event of dataPoint to take user to the corresponding page when clicked.
In that case you might also want to use “cursor” property of dataSeries/dataPoint to change mouse pointer type to “pointer”.
I’ve been considering this feature but don’t have a timeline yet. For now you can use labelAngle in such cases.
July 30, 2013 at 1:57 pm in reply to: IS it possible fire the Tooltip through the external function? #4832Peymanmi,
As of now this feature isn’t available.
—
Sunil UrsYes, you can customize legend to show any text you want. Use legendText property of dataPoint/dataSeries for the same.
https://canvasjs.com/docs/charts/basics-of-creating-html5-chart/legend/
Please take a look at this documentation page for step-to-step tutorial on rendering multiple charts in a page. Documentation also includes live example that you can try out / download.

Hi,
CanvasJS skips labels whenever the they are too close to each other. But there was a bug because of which it was skipping labels even when the interval is explicitly set. I’ve fixed the issue. You can see this working fine in the next version which is coming tomorrow.
For now as a work around you can reduce the axisX label’s font size slightly – use “labelFontSize” property.
–
Sunil Urs