Login to Ask a Question or Reply
You must be logged in to post your query.
Home › Forums › Chart Support › how to create Multiple Charts on page
how to create Multiple Charts on page
- This topic has 23 replies, 8 voices, and was last updated 9 years, 8 months ago by
Anne.
-
July 26, 2013 at 3:49 am #4824
how can i create multiple chart (two chart) in one page?
July 26, 2013 at 10:31 am #4825Please take a look at this documentation page for step-to-step tutorial on rendering multiple charts in a page. Documentation also includes live example that you can try out / download.
 July 14, 2014 at 8:16 pm #6466
Hi there,
is it possible to display charts adjacent to each other like a widget type of thing, say two charts above and two below.July 15, 2014 at 12:10 pm #6473Hi
Can you please give us some link / screenshot that depicts the kinda widget that you want to create?
July 15, 2014 at 3:09 pm #6475i don’t know if it’s a widget or what but here is the link. click on charts in this page: http://dev.sencha.com/deploy/ext-4.0.1/examples/sandbox/sandbox.html i want to display charts in one page like shown here but of course on a full page.
July 15, 2014 at 5:27 pm #6478Hi,
Yes, you can plot the chart as mentioned in the link. Because charts just get drawn inside any container you provide, it’s more about designing the container itself. Just design/place the container according to your requirement and pass its id to CanvasJS and chart should get plotted inside the same.
Here is simple example that I’ve created. You can style it according to your requirements.
May 12, 2016 at 12:23 pm #10449Hi,
I want to be able to create multiple graphs on the same page where the data to each graph comes from separate CSV files.
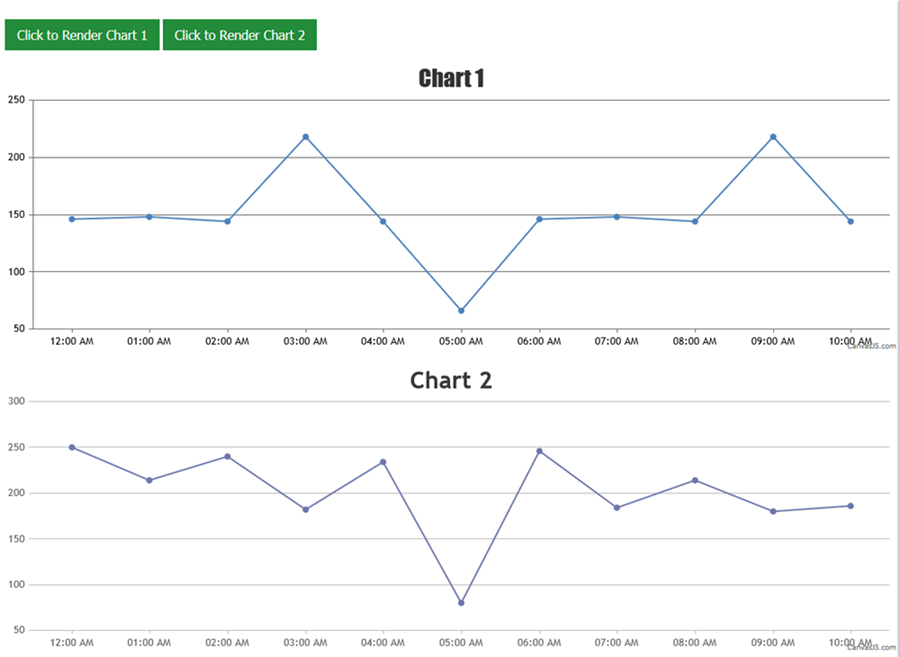
Is it possible to display buttons on the webpage, for each chart to appear, with the on click option ?-
This reply was modified 10 years, 2 months ago by
ASK123.
May 12, 2016 at 6:47 pm #10478May 23, 2016 at 4:42 pm #10544Thank you, Vishwas. How do I load data from multiple csv’s to plot the graph ? I want to send the csv filename as a parameter to the “Processdata” function.
May 25, 2016 at 3:29 pm #10558You can load data from multiple external CSV files using AJAX request. Please take a look at this documentation page for step-to-step tutorial on rendering chart with data from CSV file. Also refer to this JSFiddle for an example on rendering single chart with data from multiple CSV files.
—
Vishwas R
Team CanvasJSMay 25, 2016 at 4:05 pm #10559I tried it, it’s not working. Please can you help me with why i’m unable to plot my graphs. Thanks!
May 26, 2016 at 4:22 pm #10563Kindly check the example from the fiddle. Here is the screenshot of the working fiddle.
May 27, 2016 at 3:21 pm #10570Hi, my csv data files are in this format :
Name, x, y
abc, 1, 4
def, 2, 1
ghi, 3, 2
Please help me with implement.May 27, 2016 at 3:34 pm #10571May 27, 2016 at 8:01 pm #10574 -
This reply was modified 10 years, 2 months ago by
You must be logged in to reply to this topic.