Login to Ask a Question or Reply
Forum Replies Created by Sunil Urs
-
Yes, bar charts cannot be combined with other chart types. You can use stackedColumn if that works for you. Trendlines have been planned for version 1.3. If you can post some picture depicting what you are looking for, that would be helpful.
Hi,
As of now there is no separate element for doing that. But you can use Combination Charts to do the same. Just add a line chart and disable markers by setting markerSize to 0.
Charles,
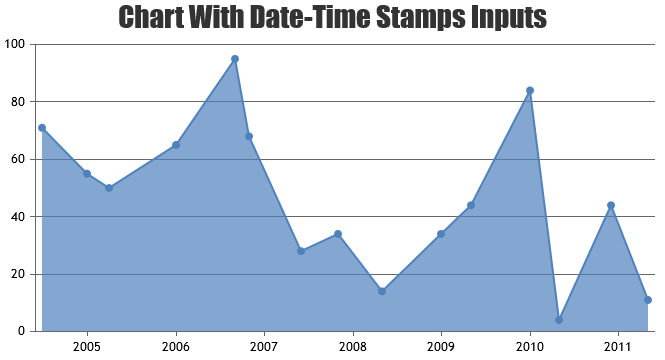
I agree that the data you have is in JSON format. But you need to convert it into a JavaScript Objects before passing it to Chart. I’ll consider supporting JSON Date Time format in future version. But for now there is an easy way to do it. You can directly send the timestamps & set xValueType property to “dataTime”.
—
Sunil UrsCharles,
Data Points are not in the expected format. You need to remove the quotes and escape characters. Below is the expected Input
{"x": new Date(1370439429173),"y":10},{"x":new Date(1370070000000),"y":30}here is a link that might be of help.
Marco,
What is going wrong is that you are assigning a new array to dps while dataPoints is still pointing to old one. So instead you should either modify existing dps array or assign a totally new array to dataPoints.
1st Approach:
var updateChart = function () {
$.getJSON(“data.php”, function (result) {dps.splice(0, dps.length);
$.each(result, function (index, value) {
dps.push(value);
});
});chart.render();
};2nd Approach:
var updateChart = function () {
$.getJSON(“data.php”, function (result) {chart.options.data[0].dataPoints = result;
});
chart.render();
};Ron,
It is being introduced in the upcoming version. You can either customize or remove the same using creditHref & creditText properties of Chart (top level). Setting either one of the properties to null will remove the link.
Samip,
That makes sense. I’ve just implemented the feature. Here is an internal build – public release will take couple of days. Do try out and let me know.
Basically you need to set “cursor” property of dataSeries / dataPoint.
—
Sunil UrsMarco,
Can you please post the JSON data that the service is returning so that I can figure out what the problem is. Do make sure that the x & y values being returned are not enclosed in quotes like “5”.
—
Sunil UrsTim,
The issue has been fixed. Thanks for reporting. Here is an internal build.
Thanks for reporting.
—
Regards,
Sunil UrsTim,
I looked into the data and here is the problem. In JavaScript, Month Value Starts from 0 and ends at 11. I know this is counter intuitive, but that is how it is in JS.
http://www.w3schools.com/jsref/jsref_getmonth.asp
So what is happening is that Month 05 in your data is actually June. As there is no 31st in June, it is being considered as July 1st. Because of this the chart is starting from July 01 23:58 and then moving on to July 01 00:00. This is reason for the oblique line.
Just reduce the month values by one (keeping the range 0-11) and it should work fine.
Tip: You might also want to look at Data/Time formatting if you want Midnight to be displayed as 00 instead of 12.
Thanks for reporting it though. I actually found another bug related to toolTip instead and have fixed the problem. I’ll email you the newer version soon after the doughnut issue is resolved. Public release is couple of days away.
—
Regards,
Sunil UrsTim,
Am looking into both the issues reported. Will get back soon.
Tim,
The link doesn’t work. Did you pull it down?… Can you please enable it for a day so that I can have a look.
Tim,
Can you please post a screenshot so that it is easier for me figure out what the problem is? Also a sample data (in JSON) that can reproduce the issue would be helpful.
gtrmanx,
That issue has been fixed in the upcoming version – 1.2 beta. Though it’ll take some time for the public release, I can give you the latest version for testing – by monday.
Suman,
Looking at the code, I can say that the problem is because you are creating the an entirely new Chart every time – while previous chart is still there – check using firebug. Instead you should create only one Chart object and call chart.render() each time you want to update (after modifying the data).
Here is a section on creating Dynamic Charts.