Login to Ask a Question or Reply
Forum Replies Created by Sunil Urs
-
gtsafas,
Can you please share a screenshot / jsfiddle so that we can understand the issue better?
—
Sunil Urs[Update]
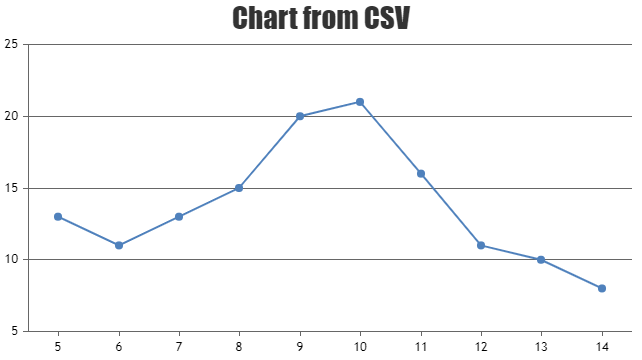
Now we have a Tutorial on Creating Charts from CSV Data in our documentation.
[Update]
Now we have a Tutorial on Creating Charts from CSV Data in our documentation.
Mahi,
May I know your browser version and OS??
—
Sunil UrsJorgemoscu,
I see that the values are directly proportional to z values: [“73″,”11″,”16″,”6″,0,”7”]. Were you able to fix the issue before I saw it by any chance??
Also, I would suggest that you always pass z values (numbers in general) as numbers instead of strings – as the result would be unpredictable otherwise. y values are being passed correctly though.
—
Sunil UrsSeptember 10, 2016 at 4:02 pm in reply to: Need to show Column chart with different bar width #12496Jagadesan,
Sorry, as of now it is not possible to have columns of different width in the same chart.
—
Sunil Ursmahi,
You can do so by setting highlightEnabled to false for those dataPoints. Here is an updated example.
—
Sunil UrsDustin,
Glad that the issue got resolved. Thanks for choosing CanvasJS.. :-)
—
Sunil UrsDustin,
Please download the commercial version from your account page. If you have done that already, please clear the browser cache and try again.
Let me know if this worked.
—
Sunil Ursgll,
We have plans to implement API to export in future versions.
But for now you can export it with a few lines of code as shown below.
1. Export Chart on Click.
2. Automatically Export ChartHope this helps.
Adish,
In that case you’ll have to reset the chart zoom programmatically using viewportMinimum and viewportMaximum before exporting.
Here is an example.
In case you want to restore zoom level after exporting, you can use rangeChanging (when user zooms into an area) to store the selected range so that you can restore it back later.
August 23, 2016 at 8:59 pm in reply to: X Axis Data Consists of year and y consists of runs made by player #11972[Update]: We have just released v1.9.0 with Logarithmic Axis. Please checkout gallery page for Logarithmic Scale.
Daniel,
We are glad that you were able to use Logarithmic Scale at your end. In case you have any feedback, feel free to let us know.
—
Sunil Urs