Login to Ask a Question or Reply
Forum Replies Created by Sunil Urs
-
tim,
This feature is planned for version 1.3 – which might take around a month.
May 27, 2013 at 5:17 pm in reply to: problem with axis label when creating the chart with first element #4610izv,
Just wanted to inform you that the latest version contains a fix for this issue. Do update.
Yes, you can do so. Because you don’t need event handler on any particular dataPoint/dataSeries but the entire Chart, you can directly use Chart’s Container element. Below is how
<div id=”chartContainer” data-url=”https://canvasjs.com” style=”width: 600px; height: 300px;”></div>
//Am using jQuery here. You can do so even with plain javascript
$(“#chartContainer”).click(function () {
window.location.href = $(this).data(“url”);
});
Stock Charts are not supported by CanvasJS yet. But it is in our Road-map.
CanvasJS requires the container’s height and width to be set in order to render. While BootStrap sets width of the container based on the class(span6, span10, etc) that you set, it doesn’t set the height. Hence the problem. Just set the height of the container (or Chart) and it should work fine.
<div class=”span10″ id=”chartContainer” style=”height: 400px;”></div>
Peymanmi,
Did you mean to say Multi Series Charts? In that case can you have a look at Multi Series Chart section.
If not, can you share a screenshot or something depicting the same?
The above code works for me except that the quotes had to be changed from “ to “.
Here is the working code
http://jsfiddle.net/canvasjs/HA2JY/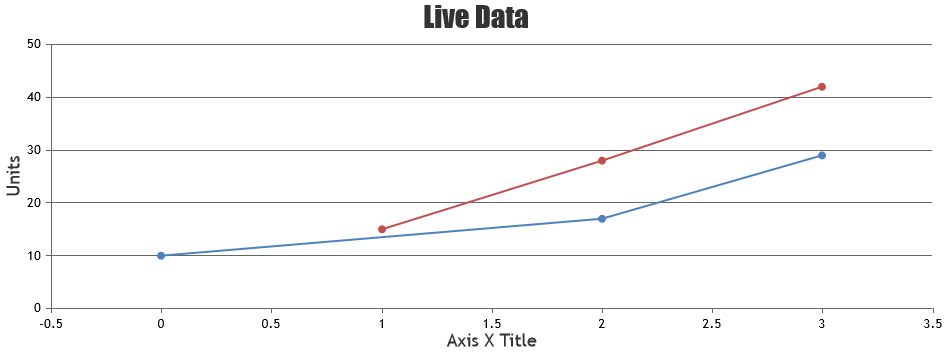
If this is not what you expected, can you please tell me the expected behavior?
Jim,
In order to show two line charts, you need to add two separate dataSeries – one for each line. You can just modify the same dataPoints array. So the code would go something like this
data: [
	{
		type: "line",
		dataPoints : dps1
	},
	{
		type: "line",//or column, area, etc
		dataPoints : dps2
	}
]
Follow the link to learn more about Multi Series Charts & Combination Charts

Thanks, have edited the same.
james,
I just looked into your json data and it seems like the json API is returning all numeric values as string. Just make sure you convert string values to number before assigning them to “y”
This should work
`dataPoints.push({ x: i, y: Number(parsed_json.history.observations[i].tempi)});`
May 16, 2013 at 5:30 pm in reply to: problem with axis label when creating the chart with first element #4521izv,
We were able to reproduce the issue. Will be fixing it at the earliest – in a day or two.
Jit,
We have not exposed the function getPlotArea and that is the reason why you are not able to call it. As of now you can only use the APIs mentioned in our documentation. May I know why you need this method?…
By default Chart takes the size of its container (if set). So you can just set the width and height of the container in which you are going to place the chart as shown below – this is the suggested method.
<div id="chartContainer" style="height: 300px; width: 500px;">Else you can also set the same using “width” and “height” property at the top level of options.
var chart = new CanvasJS.Chart("chartContainer", {
width:600,//in pixels
height:800,//in pixels
title: {
text: " Chart Title ",
}
.....
.....
}
-
This reply was modified 13 years, 1 month ago by
Sunil Urs.
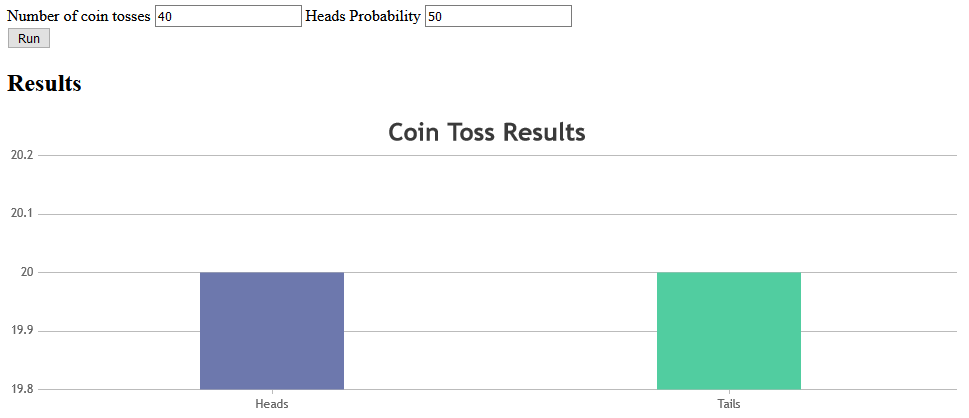
Chart is not getting rendered because its getting submitted upon click. If you just want to render chart on click of a button, don’t use “form”. Use normal text field and render the chart upon button click.
Here is your working code. Note that jsfiddle is set to execute the javascript upon onLoad event – so, you have to write onload explicitly on your local machine
-
This reply was modified 13 years, 1 month ago by