Login to Ask a Question or Reply
Forum Replies Created by Sunil Urs
-
Makes sense. I’ll implement it in the next version.
Thanks for pointing.
Automatically calculated interval is in hours and hence it is showing hours for all 3 days.
You can customize the same by setting interval to 1 and intervalType to “day”
You can do something like
chart.options.data[0].dataPoints = dataPoints1; //assign dataPoints2 to switch to another one.I was able to use Custom Google Fonts inside the Chart. Checkout the fiddle.
There are couple of things to remember though.
1. Most Browsers “start downloading” font at the point where they are used. Hence text gets rendered in regular font first and then it updates once the download completes. Checkout Paul Irish’s Blog on the same.
2. As far as I know there is no proper way to preload the fonts. Only thing that we can do is to reduce the delay or flicker due to update.
3. Remember to add a white space (with the required font) at the beginning of the document to start downloading the font at the earliest.
4. Better to render the chart with a delay of 500 ms to 1sec. This pretty much eliminates the flicker due to update in font style.—
Sunil UrsAugust 13, 2013 at 12:19 pm in reply to: How to draw an array value and repeat at the end, running real time chart #4895>> what different in for() function between j < count and j < yVal.length, changing two type this condition get two different results count determines the number of data points to be updated in one go. Because we want to render the entire array in the beginning, we use yVal.length. But after the first render we don't pass it any parameter inside setInterval because of which it defaults to 1 update every second. >> if I set time = (new Date()).getTime(); and than take time++ for seeking x Axis by time, is it the same as time.setSeconds(time.getSeconds() + 1); in your code ?
time is actually in milliseconds and doing ++ will just increment it by a millisecond and not by one second. Here you have more details.>> whats yVal[updateCount % yVal.length] mean ? Sorry I can’t get it
Modulo operator (%) is used to wrap around the yVal array once the end is reached. So once the end of array is reached, it gets you back to the first position of the array. Here it is explained with examples.August 12, 2013 at 10:10 pm in reply to: How to draw an array value and repeat at the end, running real time chart #4891You are welcome… :)
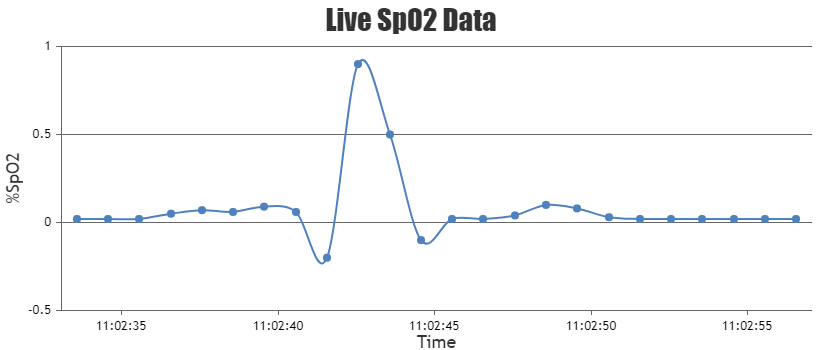
August 12, 2013 at 4:18 pm in reply to: How to draw an array value and repeat at the end, running real time chart #4887August 12, 2013 at 3:53 pm in reply to: How to draw an array value and repeat at the end, running real time chart #4886I just tried your code and it is not updating at all. So I had to make several changes to make it update the data. Hence am not sure if this is what you expected. Below is a working code.
<script type="text/javascript">
        window.onload = function () {

            var dps = []; // dataPoints
            var instance = (new Date()).getTime();
            var chart = new CanvasJS.Chart("chartContainer", {
                title: {
                    text: "Live SpO2 Data"
                },
                axisX: {
                    title: "Time",
                    valueFormatString: "hh:mm:ss"
                },

                axisY: {
                    title: "%SpO2",
                },
                data: [{
                    type: "spline",
                    xValueType: "dateTime",
                    dataPoints: dps
                }]
            });

            var yVal = [0.02, 0.02, 0.02, 0.02, 0.05, 0.07, 0.06, 0.09, 0.06, -0.2, 0.9, 0.5, -0.1, 0.02, 0.02, 0.04, 0.1, 0.08, 0.03, 0.02, 0.02, 0.02, 0.02, 0.02];
            var updateInterval = 1000;
            var maxDataLength = yVal.length; // number of dataPoints after which the series shifts
            var time = new Date();
            var updateCount = 0;

            var updateChart = function (count) {

                count = count || 1;

                for (var j = 0; j < count; j++) {
                    time.setSeconds(time.getSeconds() + 1);

                    dps.push({
                        x: time.getTime(),
                        y: yVal[updateCount % yVal.length]
                    });

                    updateCount++;

                    if (dps.length > maxDataLength) {
                        dps.shift();
                    }
                }


                chart.render();

            };

            // generates first set of dataPoints
            updateChart(maxDataLength);

            // update chart after specified time.
            setInterval(function () { updateChart();}, updateInterval);

        }

    </script>
August 11, 2013 at 11:13 pm in reply to: How to draw an array value and repeat at the end, running real time chart #4880Please checkout this documentation page on creating dynamic chart in CanvasJS with detailed explanation.

Yes, it is possible to show date & time on x axis. Just set the x value to current time just before adding it to the dataPoints array. Below is how it would look.
chart.options.data[0].dataPoints.push({x: new Date(), y: 5});And set valueFormatString to “hh:mm:ss.
—
Sunil UrsAs of now its possible only with column/bar charts. Its not available in stacked charts yet.
Sorry, reversing of Y Axis is not possible as of now.
I’ve this feature partially implemented as of now. You’ll be able to see this feature within a week or so… :-)
Yeah, I observed it. This is in fact a cleaner way of doing it. What I suggested was quick and dirty approach which probably was not right.
Savak, thanks for sharing the code…
