Login to Ask a Question or Reply
You must be logged in to post your query.
Home › Forums › Chart Support › How to draw an array value and repeat at the end, running real time chart
How to draw an array value and repeat at the end, running real time chart
- This topic has 9 replies, 2 voices, and was last updated 12 years, 11 months ago by
dungeonlegend.
-
August 11, 2013 at 8:50 pm #4878
Hi again !
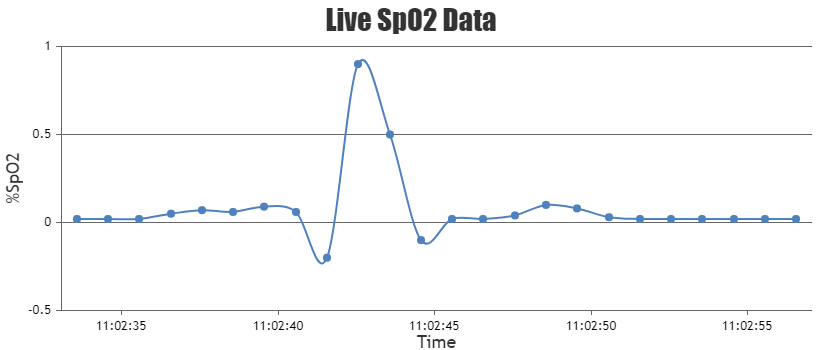
Next mini step in my project is draw a dynamic chart using a series of value running with step time. I’ve got an array[] value, example [0.02, 0.02, 0.02, 0.02, 0.05, 0.07, 0.06, 0.09, 0.06, -0.2, 0.9, 0.5, -0.1, 0.02, 0.02, 0.04, 0.1, 0.08, 0.03, 0.02, 0.02, 0.02, 0.02, 0.02]. The target is, after 1 second count, one value will be added, and when the final value is count, take back from the beginning and countinue adding.
How to push this data on Y axis, and repeat the progress ? Thank you so much.
-
This topic was modified 12 years, 11 months ago by
August 11, 2013 at 11:13 pm #4880Please checkout this documentation page on creating dynamic chart in CanvasJS with detailed explanation.
 August 12, 2013 at 1:21 pm #4884
Thank you ! But I still got a problem…
<script type="text/javascript">
	window.onload = function () {

		var dps = []; // dataPoints
                var instance = (new Date()).getTime();
		var chart = new CanvasJS.Chart("chartContainer",{
			title :{
				text: "Live SpO2 Data"
			},
                        axisX:{
                        title: "Time",
                        valueFormatString:"hh:mm:ss"
                        },

                        axisY:{
                        title: "%SpO2",
                        },
			data: [{
				type: "spline",
                                xValueType: "dateTime",
				dataPoints: dps
			}]
		});

		var yVal = [0.02, 0.02, 0.02, 0.02, 0.05, 0.07, 0.06, 0.09, 0.06,-0.2, 0.9, 0.5, -0.1, 0.02, 0.02, 0.04, 0.1, 0.08, 0.03, 0.02, 0.02, 0.02, 0.02, 0.02];
		var updateInterval = 1000;
		var dataLength = 50; // number of dataPoints visible at any point
              var time = (new Date()).getTime();

		var updateChart = function (count) {

			count = count || 1;
			// count is number of times loop runs to generate random dataPoints.

			for (var j = 0; j < yVal.length; j++) {


				dps.push({
					x: time,
					y: yVal[j]
				});
				time++;


			};
			if (dps.length > dataLength)
			{
				dps.shift();
			}

			chart.render();

		};

		// generates first set of dataPoints
		updateChart(dataLength);

		// update chart after specified time.
		seInterval(function(){updateChart()}, updateInterval);

	}
I can’t shift the frame, looks like it’s getting tighter and I can’t see the signal after few interval. I know the problem comes from if() function but I don’t know how to fix it. Can you try to use my code, you’ll see what I mean, please help me, I’m so close to get the final result !
-
This reply was modified 12 years, 11 months ago by
August 12, 2013 at 3:53 pm #4886I just tried your code and it is not updating at all. So I had to make several changes to make it update the data. Hence am not sure if this is what you expected. Below is a working code.
<script type="text/javascript">
        window.onload = function () {

            var dps = []; // dataPoints
            var instance = (new Date()).getTime();
            var chart = new CanvasJS.Chart("chartContainer", {
                title: {
                    text: "Live SpO2 Data"
                },
                axisX: {
                    title: "Time",
                    valueFormatString: "hh:mm:ss"
                },

                axisY: {
                    title: "%SpO2",
                },
                data: [{
                    type: "spline",
                    xValueType: "dateTime",
                    dataPoints: dps
                }]
            });

            var yVal = [0.02, 0.02, 0.02, 0.02, 0.05, 0.07, 0.06, 0.09, 0.06, -0.2, 0.9, 0.5, -0.1, 0.02, 0.02, 0.04, 0.1, 0.08, 0.03, 0.02, 0.02, 0.02, 0.02, 0.02];
            var updateInterval = 1000;
            var maxDataLength = yVal.length; // number of dataPoints after which the series shifts
            var time = new Date();
            var updateCount = 0;

            var updateChart = function (count) {

                count = count || 1;

                for (var j = 0; j < count; j++) {
                    time.setSeconds(time.getSeconds() + 1);

                    dps.push({
                        x: time.getTime(),
                        y: yVal[updateCount % yVal.length]
                    });

                    updateCount++;

                    if (dps.length > maxDataLength) {
                        dps.shift();
                    }
                }


                chart.render();

            };

            // generates first set of dataPoints
            updateChart(maxDataLength);

            // update chart after specified time.
            setInterval(function () { updateChart();}, updateInterval);

        }

    </script>
August 12, 2013 at 4:18 pm #4887August 12, 2013 at 9:55 pm #4889I have checked back my code and it still running as well :|, but as I can say, what you just did above exactly the same idea I ever want, even better than I could do, you plot every each items in array while I just could plot the whole series points. Although It still have a few difference things, but is it ok if I’ll turn back and get to ask you later ? Million thanks and I really appreciate what you’ve done for me. Thank you again, wish you all the best wishes :)
-
This reply was modified 12 years, 11 months ago by
August 12, 2013 at 10:10 pm #4891You are welcome… :)
August 12, 2013 at 11:16 pm #4892Cause I’ve been WOW for a little while, and after getting back to work, sorry but I have to ask you more & more…
1. what different in for() function between j < count and j < yVal.length, changing two type this condition get two different results
2. if I set time = (new Date()).getTime(); and than take time++ for seeking x Axis by time, is it the same as time.setSeconds(time.getSeconds() + 1); in your code ?
3. whats yVal[updateCount % yVal.length] mean ? Sorry I can’t get it :)
-
This reply was modified 12 years, 11 months ago by
August 13, 2013 at 12:19 pm #4895>> what different in for() function between j < count and j < yVal.length, changing two type this condition get two different results count determines the number of data points to be updated in one go. Because we want to render the entire array in the beginning, we use yVal.length. But after the first render we don't pass it any parameter inside setInterval because of which it defaults to 1 update every second. >> if I set time = (new Date()).getTime(); and than take time++ for seeking x Axis by time, is it the same as time.setSeconds(time.getSeconds() + 1); in your code ?
time is actually in milliseconds and doing ++ will just increment it by a millisecond and not by one second. Here you have more details.>> whats yVal[updateCount % yVal.length] mean ? Sorry I can’t get it
Modulo operator (%) is used to wrap around the yVal array once the end is reached. So once the end of array is reached, it gets you back to the first position of the array. Here it is explained with examples.August 13, 2013 at 2:27 pm #4896Getting new knowledge everyday ! Thank you so much :)
-
This reply was modified 12 years, 11 months ago by
-
This topic was modified 12 years, 11 months ago by
You must be logged in to reply to this topic.