Login to Ask a Question or Reply
You must be logged in to post your query.
Home › Forums › Chart Support › Graph a CSV file with number of points
Graph a CSV file with number of points
- This topic has 8 replies, 6 voices, and was last updated 9 years, 3 months ago by
Suyash Singh.
Tagged: csv
-
May 23, 2016 at 2:11 pm #10540
Hi all
I found this great piece of tool yesterday, and I’m already using this recipe: https://canvasjs.com/forums/topic/graph-a-csv-file/
Works like a charm, but is it possible to state how many lines you want to display? I’m thinking like last ten lines, og maybe based on dateThanks in advance
/Lars
May 25, 2016 at 1:00 pm #10557Baekmark,
For showing certain number of lines from the end you can modify the processData function as below for iterating over number of lines.
<!DOCTYPE html>
<html>
<head>
<script type="text/javascript" src="http://cdnjs.cloudflare.com/ajax/libs/jquery/2.1.1/jquery.js"></script>
<script type="text/javascript">

$(document).ready(function () {

    $.ajax({
        type: "GET",
        url: "Data.csv",
        dataType: "text",
        success: function (data) { processData(data); }
    });

    function processData(allText) {
        var numberOfLinesFromEnd = 10;
        var allLinesArray = allText.split('\n');
        if (allLinesArray.length > 0) {
            var dataPoints = [];
            for (var i = Math.max(0, allLinesArray.length - numberOfLinesFromEnd) ; i <= allLinesArray.length - 1; i++) {
	        var rowData = allLinesArray[i].split(',');
	        if(rowData && rowData.length > 1)
	            dataPoints.push({ label: rowData[0], y: parseInt(rowData[1]) });
            }
            chart.options.data[0].dataPoints = dataPoints;
            chart.render();
        }
    }


    var chart = new CanvasJS.Chart("chartContainer", {
        theme: "theme2",
        title: {
            text: "Basic Column Chart – CanvasJS"
        },
        data: [
        {
            type: "column",
            dataPoints: []
        }
        ]
    });

});
</script>
<script type="text/javascript" src="canvasjs.min.js"></script>
</head>
<body>
<div id="chartContainer" style="height: 300px; width: 100%;"></div>
</body>
</html>
May 25, 2016 at 4:29 pm #10560Hi Sanjoy
That did it!
Thanks a million
/Lars
September 14, 2016 at 1:07 pm #12535[Update]
Now we have a Tutorial on Creating Charts from CSV Data in our documentation.
September 19, 2016 at 7:09 pm #12579Hi,
I do have a question about graph csv file
This is how my File look like:
0 246.438 243.078 114.506 246.438 243.078 114.506
1 246.438 243.078 114.506 246.438 243.078 114.506
2 246.438 243.078 114.506 246.438 243.078 114.506
3 246.438 243.078 114.506 246.438 243.078 114.506
# any comment
4 246.438 243.078 114.506 246.438 243.078 114.506
5 246.438 243.078 114.506 246.438 243.078 114.506
6 246.438 243.078 114.506 246.438 243.078 114.506
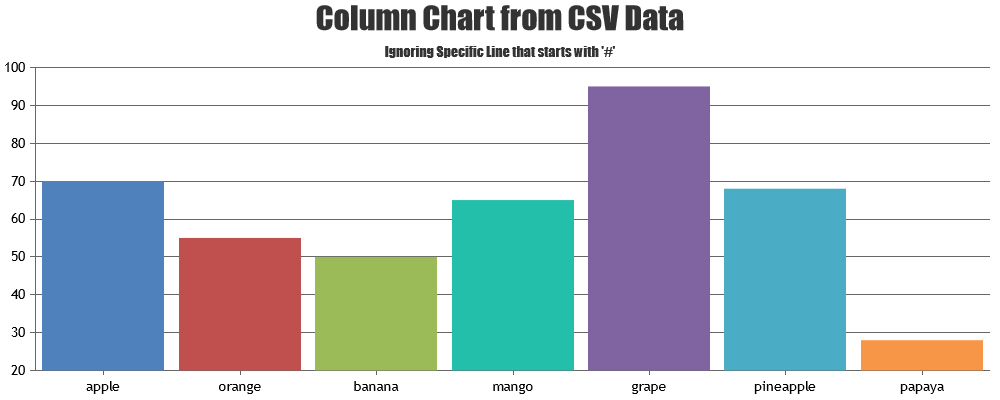
7 246.438 243.078 114.506 246.438 243.078 114.506first: is it possible to use “space” as split value?
second: how can I ignore lines which begins with # (comment) by parsingmy code:
`function processData( allText ) {
var allLinesArray = allText.split(“\n”);
if( allLinesArray.length > 0 ){var data = [];
var dataPoints1 = [];
var dataPoints2 = [];
var dataPoints3 = [];var dataSeries1 = { type: “line” };
var dataSeries2 = { type: “line” };
var dataSeries3 = { type: “line” };for (var i = 0; i <= allLinesArray.length – 1; i++) {
var rowData = allLinesArray[i].split(” “);
if (rowData && rowData.length > 1) {
if (i != 0) {
dataPoints1.push({ label:rowData[0], y:parseInt(rowData[1]) });
dataPoints2.push({ label:rowData[0], y:parseInt(rowData[2]) });
dataPoints3.push({ label:rowData[0], y:parseInt(rowData[3]) });}
}
}dataSeries1.dataPoints = dataPoints1;
dataSeries2.dataPoints = dataPoints2;
dataSeries3.dataPoints = dataPoints3;data.push(dataSeries1);
data.push(dataSeries2);
data.push(dataSeries3);var chart = new CanvasJS.Chart(“chartContainercool”,{
backgroundColor: “#e5ecf0”,
animationEnabled: true,
zoomEnabled:true,
zoomType: “x”,
title: {
text: “cool Data”
},
axisX:{
labelAngle: 0,
labelWrap:true,
labelAutoFit: false,
labelFontSize: 15,
labelMaxWidth: 200,
labelAngle: -30,
labelFontColor: “black”
},data: [
{
indexLabelPlacement: “outside”,
name: “X-Axis”,
indexLabelFontWeight: “bold”,
indexLabelFontColor: “black”,
legendText: “X-Axis”,
showInLegend: true,
color: “orange”,
type: “line”,
dataPoints: dataPoints1
},
{
indexLabelPlacement: “outside”,
name: “Y-Axis”,
indexLabelFontWeight: “bold”,
indexLabelFontColor: “black”,
legendText: “Y-Axis”,
showInLegend: true,
color: “green”,
type: “line”,
dataPoints: dataPoints2
},
{
indexLabelPlacement: “outside”,
name: “Z-Axis”,
indexLabelFontWeight: “bold”,
indexLabelFontColor: “black”,
legendText: “Z-Axis”,
showInLegend: true,
color: “blue”,
type: “line”,
dataPoints: dataPoints3
},]
});chart.render();
}
}
});September 19, 2016 at 7:44 pm #12581April 20, 2017 at 7:03 pm #14915Hi Again,
this is my code working fine right now :)
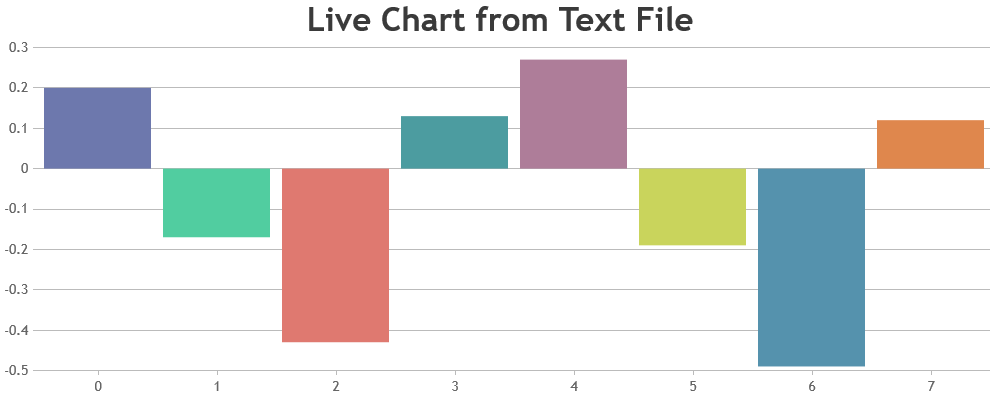
how can i update the chart using txt file as source as in my code ?
(the text file will raise continously)
Can you help me with changing my code ?$(document).ready(function () { $.ajax( { type: "GET", url: "share/cool_1.txt", dataType: "text", success: function (data) { processData(data); } }); function processData( allText ) { var allLinesArray = allText.split("\n"); if( allLinesArray.length > 0 ){ var data = []; var dataPoints1 = []; var dataPoints2 = []; var dataPoints3 = []; var dataPoints4 = []; var dataPoints5 = []; var dataPoints6 = []; var dataPoints7 = []; var dataSeries1 = { type: "line" }; var dataSeries2 = { type: "line" }; var dataSeries3 = { type: "line" }; var dataSeries4 = { type: "line" }; var dataSeries5 = { type: "line" }; var dataSeries6 = { type: "line" }; var dataSeries7 = { type: "line" }; for (var i = 0; i <= allLinesArray.length - 1; i++) if (!(allLinesArray[i].indexOf('#') !== -1)) { var rowData = allLinesArray[i].split(" "); if (rowData && rowData.length > 1) { if (i != 0) { dataPoints1.push({ label:rowData[0], y:parseInt(rowData[1]) }); dataPoints2.push({ label:rowData[0], y:parseInt(rowData[2]) }); dataPoints3.push({ label:rowData[0], y:parseInt(rowData[3]) }); dataPoints4.push({ label:rowData[0], y:parseInt(rowData[4]) }); dataPoints5.push({ label:rowData[0], y:parseInt(rowData[5]) }); dataPoints6.push({ label:rowData[0], y:parseInt(rowData[6]) }); dataPoints7.push({ label:rowData[0], y:parseInt(rowData[7]) }); } } } dataSeries1.dataPoints = dataPoints1; dataSeries2.dataPoints = dataPoints2; dataSeries3.dataPoints = dataPoints3; dataSeries4.dataPoints = dataPoints4; dataSeries5.dataPoints = dataPoints5; dataSeries6.dataPoints = dataPoints6; dataSeries7.dataPoints = dataPoints7; data.push(dataSeries1); data.push(dataSeries2); data.push(dataSeries3); data.push(dataSeries4); data.push(dataSeries5); data.push(dataSeries6); data.push(dataSeries7); var chart = new CanvasJS.Chart("chartContainercool",{ backgroundColor: "#e5ecf0", animationEnabled: true, zoomEnabled:true, zoomType: "x", title: { text: "CCcool Data" }, axisX:{ labelAngle: 0, labelWrap:true, labelAutoFit: false, labelFontSize: 15, labelMaxWidth: 200, labelAngle: -30, labelFontColor: "black" }, data: [ { indexLabelPlacement: "outside", name: "X-Axis", indexLabelFontWeight: "bold", indexLabelFontColor: "black", legendText: "X-Axis", showInLegend: true, color: "orange", type: "line", dataPoints: dataPoints1 }, { indexLabelPlacement: "outside", name: "Y-Axis", indexLabelFontWeight: "bold", indexLabelFontColor: "black", legendText: "Y-Axis", showInLegend: true, color: "green", type: "line", dataPoints: dataPoints2 }, { indexLabelPlacement: "outside", name: "Z-Axis", indexLabelFontWeight: "bold", indexLabelFontColor: "black", legendText: "Z-Axis", showInLegend: true, color: "blue", type: "line", dataPoints: dataPoints3 }, { indexLabelPlacement: "outside", name: "X-Axis Tourque", indexLabelFontWeight: "bold", indexLabelFontColor: "black", legendText: "X-Axis Tourque", showInLegend: true, color: "orange", type: "line", dataPoints: dataPoints4 }, { indexLabelPlacement: "outside", name: "Y-Axis Tourque", indexLabelFontWeight: "bold", indexLabelFontColor: "black", legendText: "Y-Axis Tourque", showInLegend: true, color: "green", type: "line", dataPoints: dataPoints5 }, { indexLabelPlacement: "outside", name: "Z-Axis Tourque", indexLabelFontWeight: "bold", indexLabelFontColor: "black", legendText: "Z-Axis Tourque", showInLegend: true, color: "blue", type: "line", dataPoints: dataPoints6 }, { indexLabelPlacement: "outside", name: "SP-Axis Tourque", indexLabelFontWeight: "bold", indexLabelFontColor: "black", legendText: "SP-Axis Tourque", showInLegend: true, color: "yellow", type: "line", dataPoints: dataPoints7 }, ] }); chart.render(); } } });April 21, 2017 at 10:33 am #14920Please refer to this forum thread for more info & example on creating chart with data from a text file.
___
Suyash Singh
Team CanvasJS
Tagged: csv
You must be logged in to reply to this topic.