Login to Ask a Question or Reply
Forum Replies Created by Sanjoy
-
Novarli,
We have gone though the source code of the page and found that chartContainer width attribute is set to 100% but while initializing the chart width property is set to 310 (px). So for some of the screen sizes/ratio there is a mismatch between chart and chartContainer which leads to clipping or leaving extra space.
Hi,
In your code in line 83, 151, 220, 289, 358, 427, 496 you have set the width property to 600 (px). Removing these lines helps in resizing the chart.
Hi,
Your fiddle is not working because you haven’t linked to jQuery, CanvasJS, CSV file/cdn.
Here is an similar example to follow.
Sorry Muralimnmcse,
In the code that you have shared, you are setting minimum & maximum, which sets the range of the axis. Setting minimum of the axis just defines the range of axis but doesn’t let you control the start position of the labels. Also, it’s not possible to control the starting point of the label as of now.
—
SanjoyWe have gone through the code snippet, once you are updating the data you should call render method on chart. In the library with resizing of window, chart automatically calls render method to fit into resized window. So, you could view updated chart once you resize the window.
Here you have to modify the following line
if(document.getElementById("Veruca").checked&&(atelesoff)){Veruca();}
asif(document.getElementById("Veruca").checked&&(atelesoff)){Veruca(); chart.render();}Doing the same with all the check-boxes (line no. 379-401 of fiddle) should fix your problem. As shown as video if you are using submit button it will be efficient to call render method inside submit button click handler.
**Note:- At any point of time if you want to show the chart with updated options/data, call render method on chart.
Hi,
In your case chart is not displayed initially because chart.render is called with data as an empty array. Calling chart.render after initializing data with dataPoints should solve the issue. If still the problem persists creating an jsfiddle will help us to understand the problem better and help you out.
And here you have a typo, instead of showinLegend it will be showInLegend.
Sorry, as of now controlling initial delay before animation start is not possible.
Akhil,
We are unable to reproduce the issue at our end. Can you kindly create a jsfiddle reproducing the issue you are facing and share it with us so that we can look into the code / chart-options being used, understand the scenario better and help you out?
—
SanjoyAre you looking for stripLines with label? If you want the interval not to change while zooming you can set interval yourself.
For the second case can you please create a jsfiddle and an image depicting the issue. So, that we can look into it and help you out.
Thanks, for reporting the issue. It’s a bug, and we have just fixed the same. Here is an internal build for you.
Hi,
As of now axisY doesn’t support dateTime. But you can achieve the same by converting dateTime to timeStamp and defining axisY labelFormatter using formatDate method. Here is an example.
Muralimnmcse,
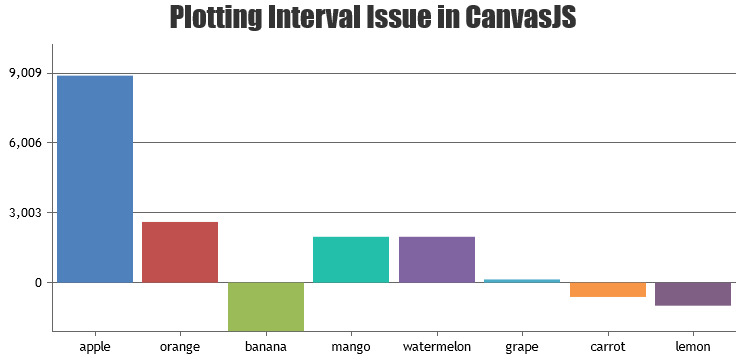
axisY is attributes of Chart options. But you seem to be passing axisY options to dataSeries instead of chart. Passing it inside chart-options should work fine in this case. Please find the code-snippet below.
var chart = new CanvasJS.Chart("chartContainer", {
  title:{
  text: "Plotting Interval Issue in CanvasJS"
  },
  axisY:{
    minimum: -2100,
    maximum: 10236,
    interval: 3003,
  },
  data: [
    {
    // Change type to "doughnut", "line", "splineArea", etc.
    type: "column",
      dataPoints: [
        { label: "apple", y: 8897.10 },
        { label: "orange", y: 2608.39 },
        { label: "banana", y: -2088.73 },
        { label: "mango", y: 1971.12 },
        { label: "watermelon", y: 1971.12 },
        { label: "grape", y: 138.52 },
        { label: "carrot", y: -615.21 },
        { label: "lemon", y: -991.10 }
      ]
    }
  ]
});

chart.render();
Please take a look at this JSFiddle for complete code.

—
Sanjoy[update]
We have just released v1.9.6 Beta with Methods & Properties, which allows you to export chart as image, print chart, programmatically access internally calculated values, etc. Please refer to the release blog for more information.
In canvasjs.min.js or canvasjs.js all chart initialized variables can be reffered using chart.options. So, here you can use
chart.options.data[0].typeto get assigned chart type of first dataSeries.Source: https://canvasjs.com/docs/charts/basics-of-creating-html5-chart/updating-chart-options/
Yes, to get the chart type of first dataSeries use
$("#chartContainer").CanvasJSChart().options.data[0].type.Source: jQuery Integration Overview