Login to Ask a Question or Reply
You must be logged in to post your query.
Home › Forums › Chart Support › Y-Axis Minimum,Maximum and Interval Manual Plotting
Y-Axis Minimum,Maximum and Interval Manual Plotting
- This topic has 9 replies, 5 voices, and was last updated 4 years, 9 months ago by
Vishwas R.
-
July 23, 2016 at 2:59 pm #11601
Hai,
I have my own standardised logic for calculating the max,min and interval values for my graphs, but when i apply the same in canvas the max,min and interval values gets auto changed. Please let me know how to avoid the same.
Sample:
var chart = new CanvasJS.Chart(“chartContainer”, {
title:{
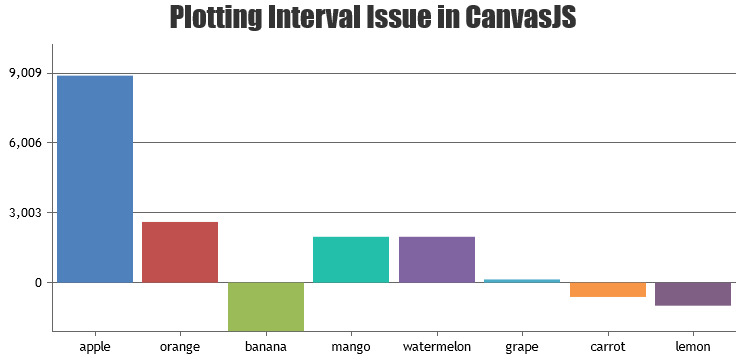
text: “Plotting Interval Issue in CanvasJS”
},
data: [
{
// Change type to “doughnut”, “line”, “splineArea”, etc.
type: “column”,
axisY:{
minimum: -2100,
maximum: 10236,
interval: 3003,
},
dataPoints: [
{ label: “apple”, y: 8897.10 },
{ label: “orange”, y: 2608.39 },
{ label: “banana”, y: -2088.73 },
{ label: “mango”, y: 1971.12 },
{ label: “watermelon”, y: 1971.12 },
{ label: “grape”, y: 138.52 },
{ label: “carrot”, y: -615.21 },
{ label: “lemon”, y: -991.10 }
]
}
]
});chart.render();
July 25, 2016 at 12:16 pm #11603Muralimnmcse,
axisY is attributes of Chart options. But you seem to be passing axisY options to dataSeries instead of chart. Passing it inside chart-options should work fine in this case. Please find the code-snippet below.
var chart = new CanvasJS.Chart("chartContainer", {
  title:{
  text: "Plotting Interval Issue in CanvasJS"
  },
  axisY:{
    minimum: -2100,
    maximum: 10236,
    interval: 3003,
  },
  data: [
    {
    // Change type to "doughnut", "line", "splineArea", etc.
    type: "column",
      dataPoints: [
        { label: "apple", y: 8897.10 },
        { label: "orange", y: 2608.39 },
        { label: "banana", y: -2088.73 },
        { label: "mango", y: 1971.12 },
        { label: "watermelon", y: 1971.12 },
        { label: "grape", y: 138.52 },
        { label: "carrot", y: -615.21 },
        { label: "lemon", y: -991.10 }
      ]
    }
  ]
});

chart.render();
Please take a look at this JSFiddle for complete code.
—
SanjoyJuly 29, 2016 at 2:06 pm #11637Hi Sanjoy,
I don’t have problem in data loading, the issue is with the plotting intervals,
Sample:
var chart = new CanvasJS.Chart(“chartContainer”, {
title:{
text: “Plotting Interval Issue in CanvasJS”
},
axisY:{
minimum: -109,
maximum: 60,
interval: 42.25
},
data: [
{
// Change type to “doughnut”, “line”, “splineArea”, etc.
type: “column”,
dataPoints: [
{ label: “apple”, y: 51.9 },
{ label: “orange”, y: 7.75 },
{ label: “banana”, y: 5.07 },
{ label: “mango”, y: 2.59 },
{ label: “watermelon”, y: 2.58 },
{ label: “grape”, y: 1.09 },
{ label: “carrot”, y: 0.04 },
{ label: “lemon”, y: -0.01 },
{ label: “jackfruit”, y: -0.01 },
{ label: “custardapple”, y: -0.02 },
{ label: “butterfruit”, y: -29.11 },
{ label: “jackfruit”, y: -94.29 }
]
}
]
});chart.render();
In the above sample the canvasjs automatically changes my max,min and intervals and the plotting intervals are -84.5,-42.25,0,42.25 but it should have been -109,-66.75,-24.5,17.75,60.
July 29, 2016 at 2:34 pm #11639Sorry Muralimnmcse,
In the code that you have shared, you are setting minimum & maximum, which sets the range of the axis. Setting minimum of the axis just defines the range of axis but doesn’t let you control the start position of the labels. Also, it’s not possible to control the starting point of the label as of now.
—
SanjoyJuly 29, 2016 at 2:41 pm #11640Sanjoy,
Thanks for your quick update, request you to keep me posted in this regards.
February 15, 2018 at 5:07 pm #19656Hi
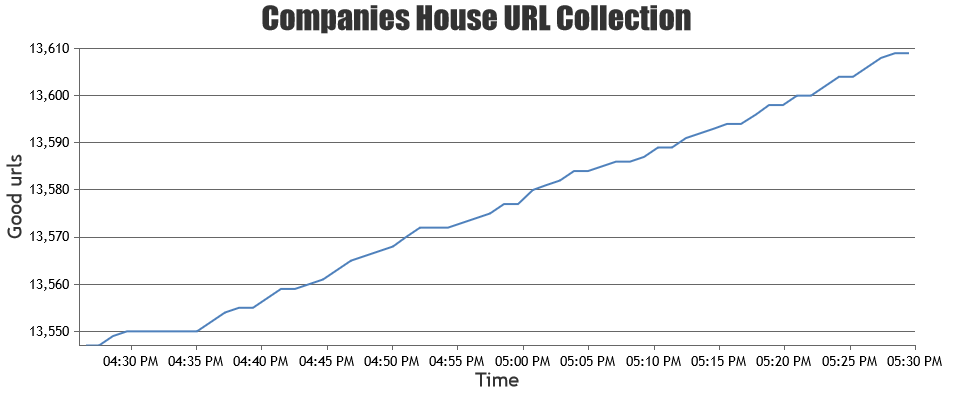
Is it possible to dynamically change the axisY minimum value so that it is always the lowest y value? The example chart is https://negotiation.azurewebsites.net/helloworld.php. In this case I want the axisY minimum to be the lowest y value
Thanks
February 15, 2018 at 6:48 pm #19657Yes, you can set axisY minimum to the lowest y-value. You can achieve that by finding the lowest y-value and changing axisY minimum using set method. Please take a look at this JSFiddle.
—
Vishwas R
Team CanvasJSOctober 23, 2021 at 10:01 pm #36103Hello,
Is there a scale interval function for the Y-Axis which works between manually set Minimum and Maximum values? So that the Y-Axis always represents/shows the minimum and maximum values within the Graph
October 25, 2021 at 7:08 pm #36125Axis minimum & maximum are auto-calculated based on the range of data being passed to the chart – which you can access using get method after rendering the chart. Or you can manually set minimum & maximum using set method. However, to set minimum / maximum of axis to the lowest / highest values of the datapoints passed, you can do so as addressed in the previous reply. Please find the code-snippet below.
var minY = Infinity, maxY = -Infinity;
var minimum = chart.axisX[0].get("minimum");
var maximum = chart.axisX[0].get("maximum");
for(var i = 0; i < chart.data[0].dataPoints.length; i++){
  if(chart.data[0].dataPoints[i].x >= minimum && chart.data[0].dataPoints[i].x <= maximum){
    if(chart.data[0].dataPoints[i].y < minY)
      minY = chart.data[0].dataPoints[i].y;

    if(chart.data[0].dataPoints[i].y > maxY)
      maxY = chart.data[0].dataPoints[i].y;
  }
}
chart.axisY[0].set("minimum", minY);
chart.axisY[0].set("maximum", maxY);
—
Vishwas R
Team CanvasJS
You must be logged in to reply to this topic.