Login to Ask a Question or Reply
Forum Replies Created by Sanjoy
-
Hello,
We checked with the code you have provided and we are unable to find any memory leakage. It would help us to check into the issue if you can provide the following details.
1. OS and version
2. Browser and versionKindly create a fiddle.
@flo,
We are unable to reproduce the issue at our end. Please refer the screenshot below.

And the best way to test in IE8 is using IE8 virtual machine.
**************** Update ****************
We just release v1.8.1 Beta with connectNullData feature which will allow you to do the same.
uberTof,
Axis label overlapping issue has-been fixed in version 1.8.1 Beta 1. The result will be reflected in your fiddle.
April 20, 2016 at 9:42 pm in reply to: Datetime Axis Label Overlap (given certain conditions) #10323Reggie,
This issue has been fixed in version 1.8.1 beta. The results will be reflected in your fiddle.
Prasanna,
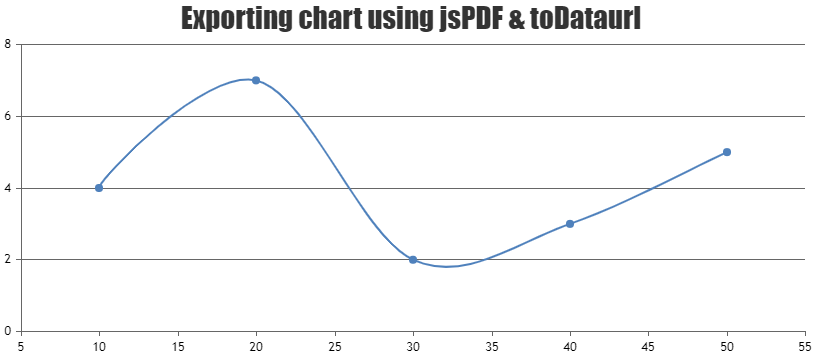
Exporting Chart data to excel or pdf is not available as an inbuilt feature as of now. However, you can can export chart to pdf using jsPDF as shown in the below code snippet.
$("#exportButton").click(function(){
    var pdf = new jsPDF();
    pdf.addImage(dataURL, 'JPEG', 0, 0);
    pdf.save("download.pdf");
});
Please take a look at this JSFiddle for an example on exporting chart to pdf using jsPDF.
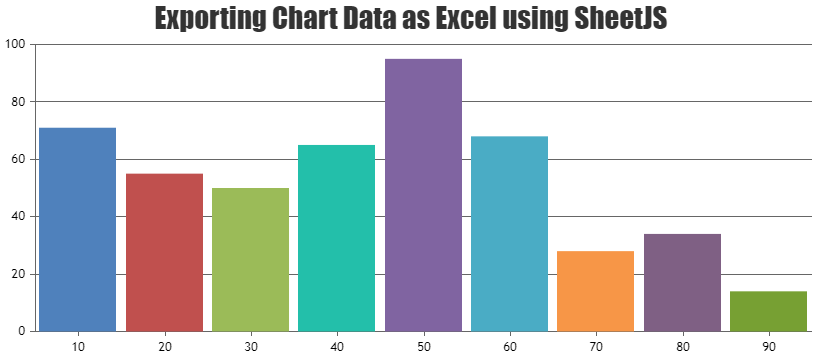
For exporting into Excel you can use libraries like excelbuilder or SheetJS. Please take a look at this JSFiddle for exporting chart data to excel using SheetJS.
—-
Sanjoy Debnath
Team CanvasJSDanny,
Thanks for reporting this issue. But we are unable to reproduce it with chrome version 50. Here is the screenshot of your fiddle in chrome-v50. Can you please mention your chrome version along with OS.
Sorry, Jacob
We are considering this feature for future versions but we don’t have exact timeline yet.
Are you looking for mouseover event, where you can get the currently hover dataPoint’s x and y values like e.dataPoint.x and e.dataPoint.y. Or else you can look into toolTip contentFormatter.
If this doesn’t suite your requirements, could you please provide us a pictorial representation to understand better.
Lasse,
You can use xValueFormatString to your desired date-format.
Hi,
Are you looking for this example, which is working across all the platforms. If this doesn’t fulfil your requirement please share an pictorial representation to help us understand your requirement better.
Hi Lakshman,
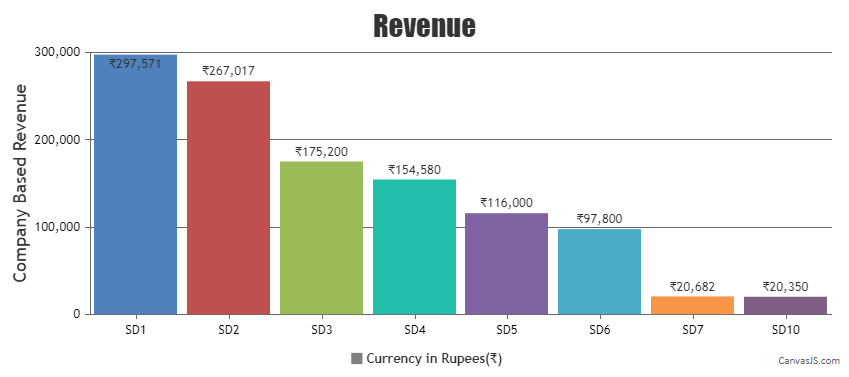
In order to represent “₹”, you can use the “\u20B9” Unicode. You can set the indexLabel property to the Unicode mentioned above to show the Rupee symbol inside the chart.
Kindly take a look at the code snippet below,
  data: [
    {
      type: "column",
      showInLegend: true,
      legendMarkerColor: "grey",
      legendText: "Currency in Rupees(\u20B9)",
      indexLabel: "\u20B9{y}",
      dataPoints: [
        {y: 297571, label: "SD1"},
        {y: 267017, label: "SD2" },
        {y: 175200, label: "SD3"},
        {y: 154580, label: "SD4"},
        {y: 116000, label: "SD5"},
        {y: 97800, label: "SD6"},
        {y: 20682, label: "SD7"},
        {y: 20350, label: "SD10"}
      ]
    }]
Also, please take a look at this JSFiddle for an example on setting Rupee Symbol as the indexLabel using Unicode.
Daniel Silva,
In canvasjs api you can unset a property by setting it to null. So, by setting minimum to null will revert it to automatically calculated value.
Hi Jacob,
Thanks for bringing this to our notice. In earlier version of CanvasJS user had access to internal methods and variables which has been kept private from version 1.8. But in the future versions, we are planning to give user structured internally calculated values such as minimum and maximum. As of now, if you know the maximum value suiting to your requirement, you can set it for axisY2 and after that e.chart.options.axisY2.maximum will be available.