Login to Ask a Question or Reply
You must be logged in to post your query.
Home › Forums › Feature Requests & Feedback › Support for HTML unicode characters
Support for HTML unicode characters
- This topic has 4 replies, 3 voices, and was last updated 6 years, 6 months ago by
jhodgeswaterford.
-
April 6, 2016 at 7:13 pm #10104
Hi, I have the following canvas js code for my graph,
`var line=new CanvasJS.Chart(“chartContainer_line”,
{title:{
text: “Revenue”,
fontFamily: “calibri black”
},
animationEnabled: true,
axisY: {
title: “Company Based Revenue”
},
legend: {
verticalAlign: “bottom”,
horizontalAlign: “center”
},
theme: “theme1”,
data: [{
type: “column”,
showInLegend: true,
legendMarkerColor: “grey”,
legendText: “Currency in Rupees(₹)”,
dataPoints: [
{y: 297571, label: “SD1”},
{y: 267017, label: “SD2” },
{y: 175200, label: “SD3”},
{y: 154580, label: “SD4”},
{y: 116000, label: “SD5”},
{y: 97800, label: “SD6”},
{y: 20682, label: “SD7”},
{y: 20350, label: “SD10”}
]
}
]
});
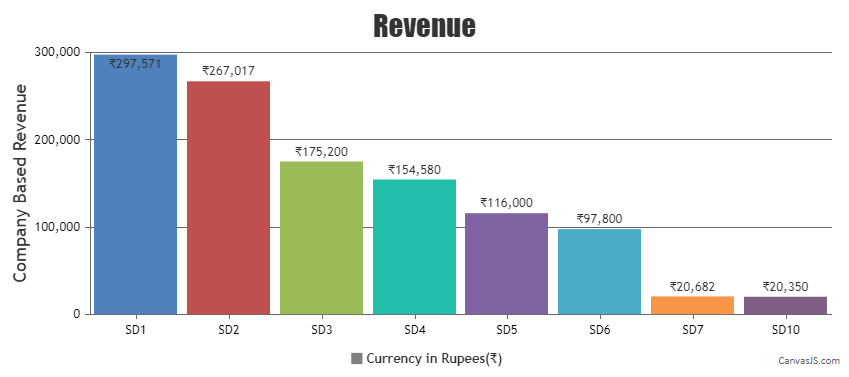
line.render();`As you can notice the legendText attribute i have specified the text ₹ and it recognized the rupee symbol, I want to add the html unicode characters to show the Rupee symbol inside the Chart. Thanks for help.
April 7, 2016 at 12:29 pm #10112Hi Lakshman,
In order to represent “₹”, you can use the “\u20B9” Unicode. You can set the indexLabel property to the Unicode mentioned above to show the Rupee symbol inside the chart.
Kindly take a look at the code snippet below,
  data: [
    {
      type: "column",
      showInLegend: true,
      legendMarkerColor: "grey",
      legendText: "Currency in Rupees(\u20B9)",
      indexLabel: "\u20B9{y}",
      dataPoints: [
        {y: 297571, label: "SD1"},
        {y: 267017, label: "SD2" },
        {y: 175200, label: "SD3"},
        {y: 154580, label: "SD4"},
        {y: 116000, label: "SD5"},
        {y: 97800, label: "SD6"},
        {y: 20682, label: "SD7"},
        {y: 20350, label: "SD10"}
      ]
    }]
Also, please take a look at this JSFiddle for an example on setting Rupee Symbol as the indexLabel using Unicode.
 January 8, 2020 at 7:05 pm #27937
I’m passing into an Angular component the following:
<componentName yAxisLabel=”\u00B5W / cm\u00B2″></componentName>
Then, within the component I am using the @Input value like this:
@Input() yAxisLabel: string;
……CanvasJS Chart config…
axisY: {
title: this.yAxisLabel
}…
However, the chart translates it literally as “\u00B5W / cm\u00B2” which is what displays as the axis title. It works just fine if I hard-code the title, but not as an input value.
Solution:
Where I was passing: “\u00B5W / cm\u00B2”
I now pass the HTML Entity: “µW / cm²”…CanvasJS Chart config…
axisY: {
title: this.yAxisLabel
}…
Works like a charm.
A great reference for HTML entities, etc: https://www.toptal.com/designers/htmlarrows/
-
This reply was modified 6 years, 6 months ago by
-
This reply was modified 6 years, 6 months ago by
-
This reply was modified 6 years, 6 months ago by
You must be logged in to reply to this topic.