Login to Ask a Question or Reply
Forum Replies Created by Manoj Mohan
-
Please have a look at this gallery example on creating chart using JSON data received from ajax request in ASP.NET MVC. To add color in the datapoints, along with the above mentioned solution you need to add color property while parsing the JSON received from the service. Please check out the code snippet below for the same.
function addData(data) {
  for (var i = 0; i < data.length; i++) {
    dataPoints.push({
      x: new Date(data[i].x),
      y: data[i].y,
      color: data[i].color
    });
  }
  chart.render();
}
If you are still facing issue, kindly create a sample project reproducing the issue you are facing and share it with us over Google-Drive or Onedrive along with sample data so that we can look into your code, run it locally at our end to understand the scenario better and help you out?
—-
Manoj Mohan
Team CanvasJSPlease check out this gallery example for creating range bar chart in ASP.NET MVC. In order to add color to the datapoint, you can modify the DataPoint Model class to include color property as well as while creating DataPoint object include color required. Please take a look at the below code snippet for the same
/* DataPoint Model Class */
public DataPoint(string label, double[] y, string color)
{
  this.Label = label;
  this.Y = y;
  this.Color = color;
}

//Explicitly setting the name to be used while serializing to JSON.
[DataMember(Name = "label")]
public string Label = "";

//Explicitly setting the name to be used while serializing to JSON.
[DataMember(Name = "y")]
public double[] Y = null;

[DataMember(Name = "y")]
public string Color = null;
.
.
/* Controller */
dataPoints.Add(new DataPoint("Owl", new double[] { 200, 1200 }, "#369EAD"));
.
.
—-
Manoj Mohan
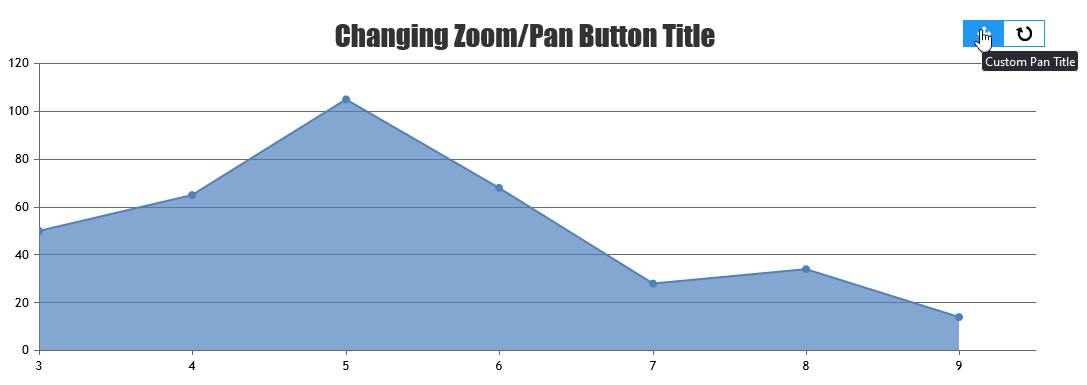
Team CanvasJS1. Zoom, Pan and Reset options should be enabled by default and the Zoom option should be selected by default. Mouse Hover description to be displayed
Setting axis viewportMinimum or viewportMaximum will display the toolbar by default. You can set the zoomText, panText and resetText of the culture property to customize the mouse hover description of Zoom, Pan and Reset buttons respectively.
CanvasJS.addCultureInfo("custom", {
     zoomText: "Custom Zoom Title",
    panText: "Custom Pan Title",
        resetText: "Custom Reset Title"
});

var chart = new CanvasJS.Chart("chartContainer", {
  culture: "custom",
  .
  .
});
2. Zoom & Pan Icons should be 2 separate icons. Upon selecting any of these icons mouse cursor should change it to the icon’s image.
Sorry, it’s not possible to show Zoom and Pan buttons as separate buttons in chart as of now.
—-
Manoj Mohan
Team CanvasJSSorry, it’s not possible to disable panning in the stock chart as of now.
—-
Manoj Mohan
Team CanvasJSYou can use zoomText and panText attributes of culture to customize the text shown in the tooltip of zoom & pan button respectively. Please take a look at this below code snippet.
CanvasJS.addCultureInfo("custom", {
 	zoomText: "Custom Zoom Title",
	panText: "Custom Pan Title"
});

var chart = new CanvasJS.Chart("chartContainer", {
  culture: "custom",
  .
  .
});
Please take a look at this updated JSFiddle for complete working code.
—-
Manoj Mohan
Team CanvasJSThanks for the feedback. We will look into this in future releases.
—-
Manoj Mohan
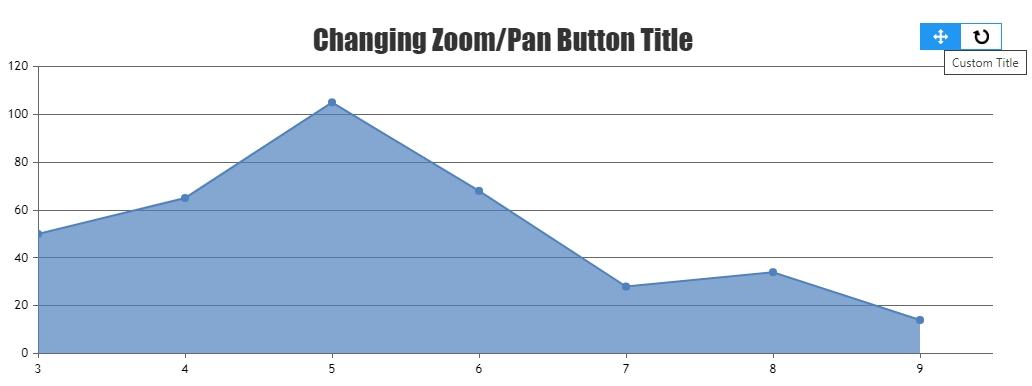
Team CanvasJSThere seems to be some issue, which has been notified to dev team & would fix it in future versions. Meanwhile, you can work-around this by changing title attribute of the zoom/pan button based on the state of the button (Zoom / Pan) as shown in this updated JSFiddle.
—-
Manoj Mohan
Team CanvasJSYou can change the tooltip text shown when you hover the zoom/pan button by changing the title attribute for the DOM. Please find the code-snippet below.
document.getElementsByClassName("canvasjs-chart-toolbar")[0].childNodes[0].title = "New Title";Please take a look at this JSFiddle for an example on the same.
—-
Manoj Mohan
Team CanvasJSSorry, we don’t have gauge chart as of now. However, you can create it with help of semi doughnut chart as explained briefly in this thread. Also, please refer to this forum thread for an example on the same in Angular.
—-
Manoj Mohan
Team CanvasJS@avb,
Zooming seems to be working fine on enabling zoom in individual charts in stockchart. Please take a look at this JSFiddle for working sample on the same.
If you are still facing the issue, kindly share the JSFiddle reproducing the issue you are facing so that we can look into your options passed to the chart, understand your scenario better and help you out.
—-
Manoj Mohan
Team CanvasJSJustin,
Please take a look at this JSFiddle that shows an example of using labels to show date instead of x-values.
—-
Manoj Mohan
Team CanvasJSDecember 16, 2022 at 6:15 pm in reply to: Range Select Buttons not highlighted if rangeChanging option used #41682[UPDATE]
We have just released StockChart v1.10.12 with this bug fix. Please refer to the release blog for more information. Do download the latest version from download page & let us know your feedback.
@avb,There seems to be an issue when navigator is disabled due to which selected range button is not highlighted after rendering the chart. You can workaround this issue by hiding the navigator using css and also setting selectedRangeButtonIndex in the rangeChanging event handler. Please take a look at this below code snippet.
<style>
#stockChartContainer .canvasjs-navigator-panel {
  display: none !important;
}
</style>

rangeChanged: function(e) {
.
.
if(e.source == "buttons") {
  stockChart.rangeSelector.set("selectedRangeButtonIndex", e.index, false);
}
.
.
}
Please take a look at this updated JSFiddle for complete working code.
—-
Manoj Mohan
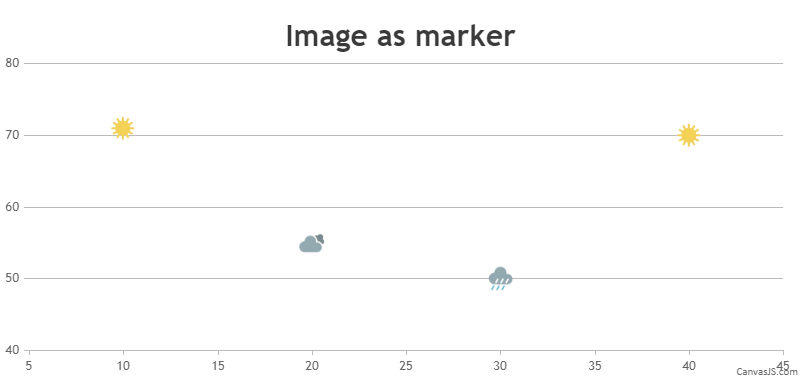
Team CanvasJSReplacing bubble with custom image/svg is not available as an inbuilt feature as of now. However, you can position images in place of markers in bubble chart by adding few lines of code. Please checkout the code snippet below for the same.
addMarkerImages(chart);

function addMarkerImages(chart){
  for(var i = 0; i < chart.data[0].dataPoints.length; i++){

    customMarkers.push($("<img>").attr("src", chart.data[0].dataPoints[i].markerImageUrl)
                       .css("display", "none")
                       .css("height", 30)
                       .css("width", 30)
                       .css("pointer-events", "none")
                       .appendTo($("#chartContainer>.canvasjs-chart-container"))
                      );
    positionMarkerImage(customMarkers[i], i);
  }
}

function positionMarkerImage(customMarker, index){
  var pixelX = chart.axisX[0].convertValueToPixel(chart.options.data[0].dataPoints[index].x);
  var pixelY = chart.axisY[0].convertValueToPixel(chart.options.data[0].dataPoints[index].y);

  customMarker.css({"position": "absolute",
                    "display": "block",
                    "top": pixelY - customMarker.height()/2,
                    "left": pixelX - customMarker.width()/2,
                    "pointerEvents": "none"
                   });
}
Please take a look at this JSFiddle for complete working code.
2) How can I connect two bubbles with a straight line on mouse hover?
It is not possible to connect two bubble with a straight line on mouse hover as of now.
—-
Manoj Mohan
Team CanvasJSSorry, it’s not possible to define the position of first & last labels in the axis as of now. However, you can use label instead of x values to show the axis labels as per your requirement.
—-
Manoj Mohan
Team CanvasJS