@appsoft,
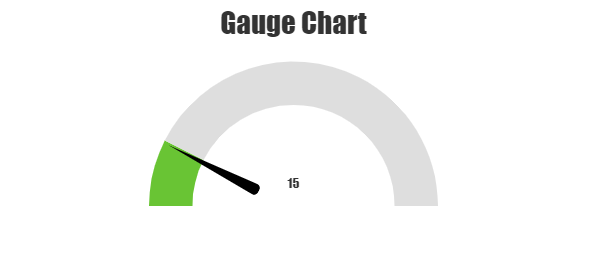
You can easily add needle to gauge chart as explained briefly in this thread. As briefed in the thread, adding a div and customizing it’s style to position it on top of chart should work in your case.
/*HTML*/
<div class="speedometer-needle" #needle></div>

/* CSS */
.speedometer-needle {
  position: absolute;
  width: 30px;
  height: 30px;
  border-radius: 50%;
  background: transparent;
  top: 50%;
  left: 50%;
  transition: 0.3s ease-in-out;
  transform: translate(-50%, 0%) rotate(0deg);
  margin: 8px 0 0;
}

.speedometer-needle:before {
  content: '';
  position: absolute;
  border-radius: 5px;
  border: 6px solid transparent;
  border-right: 100px solid #000;
  left: -130px;
  top: 10px;
  width: 0;
  height: 0;
}

/* To position the needle above chart based on value */
this.renderer.setStyle(
      this.needle.nativeElement,
      'transform',
      'translate(-50%, 0%) rotate(' +
        parseInt(this.gauge.valueText.text) * (180 / this.gauge.maximum) +
        'deg)'
);
Please take a look at this Stackblitz project for complete working code.
—-
Manoj Mohan
Team CanvasJS
.