Home Forums Chart Support Multi Series Stacked Column Chart

Multi Series Stacked Column Chart

Viewing 5 posts - 1 through 5 (of 5 total)
  • #20876

    Hi Sir,

    Can we create Multi Series Stacked Column Chart with CanvasJS?

    Something like this: https://peltiertech.com/images/2011-07/CS_Col_00.png

    Thanks!

    #20882

    @liyen,

    You can achieve Multi-Series Stacked Column Chart(grouped stacked chart) by attaching dataSeries to different axes. Please take a look at this jsfiddle.

    __
    Priyanka M S
    Team CanvasJS

    #20916

    Thanks for your sharing Priyanka :)

    #40050

    Hi Sir ,

    My requirement to create multi series stacked column chart, which I have done by your given solution https://jsfiddle.net/2jtmcddy/ , Thanks for your code.
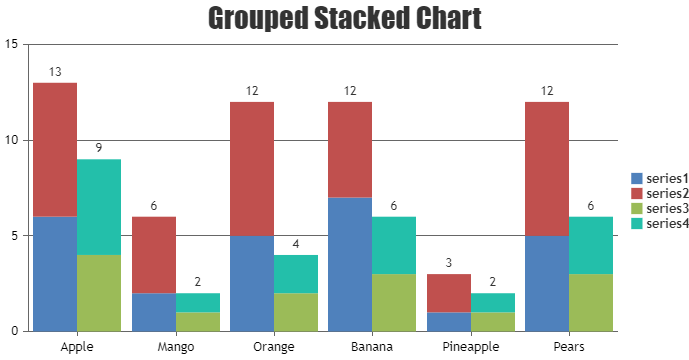
    But I am facing issue to indexLabel (I have to show total on top of each column). It is not showing on correct position.
    I have some data for last 7 dates for 3 region (UK, US, Asia) with failed and success count. I have used Secondary and Tertiary axisType. Basically it is 3 column together(UK, US, Asia) of last 7 dates with success and failed count.

    I wanted to show Total count on top of each column for which I have used indexLabel. but it is not coming in correct position. Can you help me to fix this issue?

    #40124

    @er-khushboo27,

    You can show indexlabels to the top most dataseries of each stacked column by setting indexLabelPlacement property to “outside”. Please take a look at this updated JSFiddle for a working example.

    Grouped Stacked Column with Indexlabel

    If this doesn’t fulfill your requirements, can you kindly brief us more along with an example or a pictorial representation of your requirements so that we can understand it better and help you out?

    —-
    Manoj Mohan
    Team CanvasJS

Viewing 5 posts - 1 through 5 (of 5 total)

You must be logged in to reply to this topic.