Login to Ask a Question or Reply
You must be logged in to post your query.
Home › Forums › Chart Support › Synchronized Charts
Synchronized Charts
- This topic has 12 replies, 4 voices, and was last updated 3 years, 7 months ago by
Manoj Mohan.
Tagged: numeric data, Synchronize
-
March 17, 2021 at 9:04 pm #33424
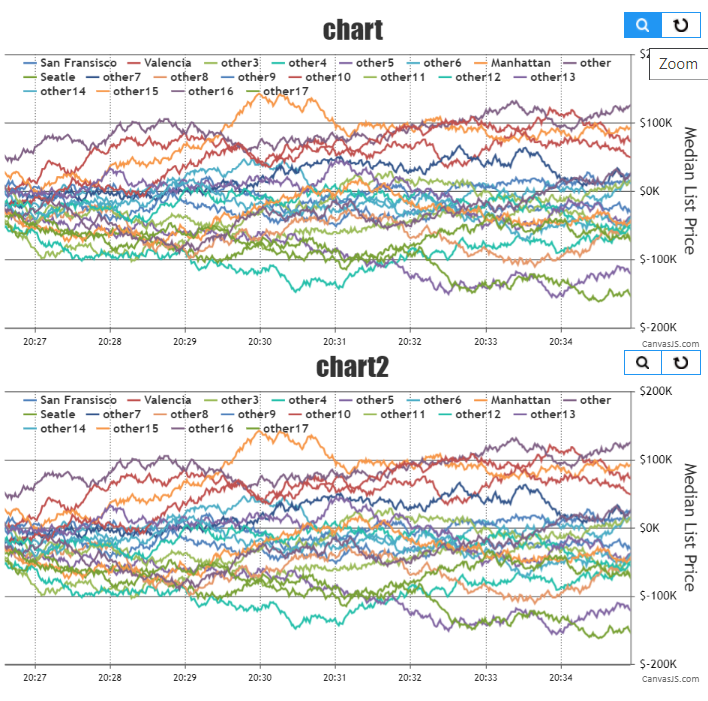
Hello every one, is there an option to synchronized panning/zooming option?
I mean if I do a zoom in one chart and then change to pan, can i change the option in the other to pan chart as well?
I let you my jsfiddle
Thanks!
-
This topic was modified 5 years, 4 months ago by
Nerviozzo96.
March 18, 2021 at 10:52 pm #33500Yes, it is possible to sync zoom / pan button across multiple charts. You can achieve this by triggering the click event on the zoom / pan button on all charts when a user clicks on it in one of the charts as shown below:
function syncZoomPanButtonClick() {
  var toolbars = document.getElementsByClassName("canvasjs-chart-toolbar");
  for(var j = 0; j < toolbars.length; j++) {
    toolbars[j].firstChild.addEventListener("click", function(e) {
      for(var j = 0; j < toolbars.length; j++){
        if(this != toolbars[j].firstChild && e.isTrusted === true) {
          toolbars[j].firstChild.click();
        }
      }
    });
  }
}
Please take a look at this JSFiddle for a working example with sample code.
—
Shashi Ranjan
Team CanvasJSMarch 22, 2021 at 9:51 pm #33610Thanks!
May 25, 2021 at 7:13 pm #34388Hi there, im having a little problem with this.
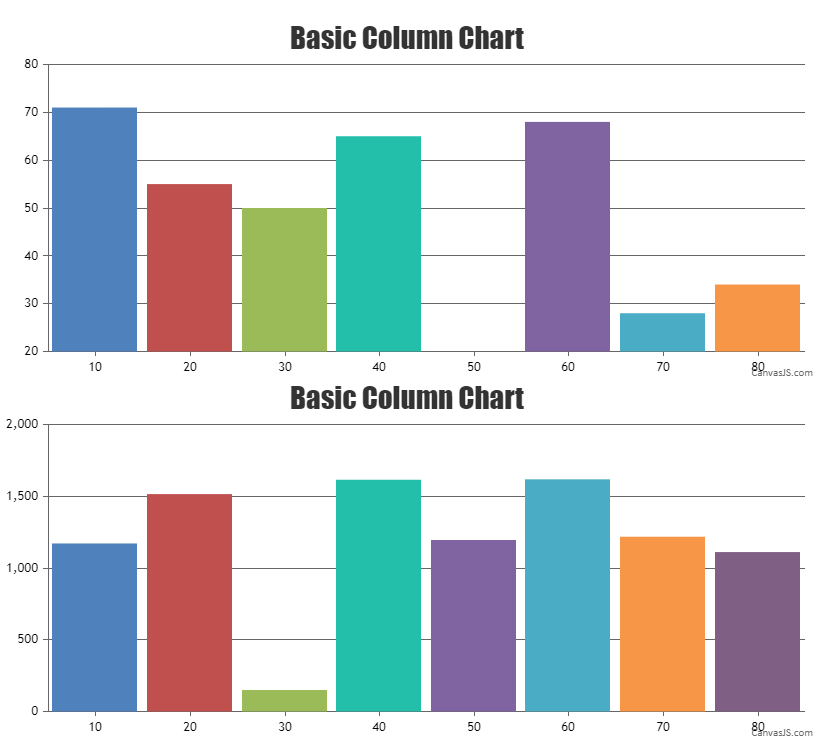
I want to have 2 charts with different values (that mean different maximums) with same width or margin.
jsfiddle
I let you an image to clarify what I meanMay 25, 2021 at 7:56 pm #34448You can align y-axis across multiple charts by setting the margin property. The margin value has to be calculated based on the bounds of y-axis as shown in the code below –
var axisYBoundMax = 0;
for (var i=0; i<charts.length; i++) {
  axisYBoundMax = Math.max(axisYBoundMax, charts[i].axisY[0].bounds.x2);
}

for(var i = 0; i < charts.length; i++) {
  charts[i].axisY[0].set("margin", axisYBoundMax - (charts[i].axisY[0].bounds.x2 - charts[i].axisY[0].bounds.x1));
}
Please take a look at this JSFiddle for complete working code.
—-
Manoj Mohan
Team CanvasJSJune 3, 2021 at 2:14 pm #34510Thanks, I guess the same applies for the x axis right?
June 3, 2021 at 7:01 pm #34514Hi there, this dont work on chart updates. I let you the example
Try to hide and show Series multiple timesJune 4, 2021 at 7:05 pm #34525Thanks, I guess the same applies for the x axis right?
Yes, you can align x-axis across multiple chart using same logic as mentioned above.
Hi there, this dont work on chart updates. I let you the example
Try to hide and show Series multiple timesYou can reset the margin of y-axis to 0 before aligning the y-axis across multiple charts as shown in the code snippet below.
for(var i = 0; i < charts.length; i++) {
   charts[i].axisY[0].set("margin", 0);
}
Also, please take a look at this updated JSFiddle for complete code.
—-
Manoj Mohan
Team CanvasJSNovember 29, 2022 at 6:41 pm #40137This link decribes syncronized charts
https://canvasjs.com/javascript-charts/synchronized-charts/It is populated with json $.get(“https://canvasjs.com/data/gallery/javascript/server-matrics.json”, function(data) {
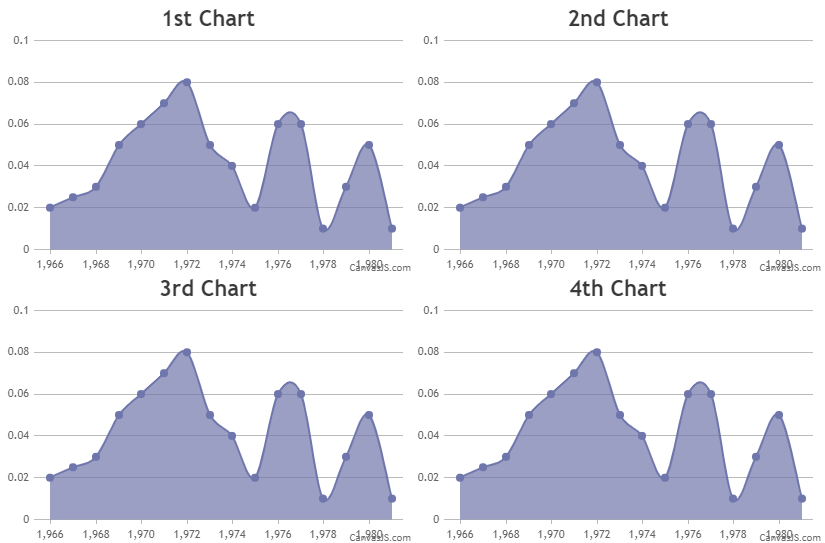
for (var i = 1; i < data.length; i++) {…………….Can anyone tell me the syntax to supply 4 graphs with data of this form instead
{ x: 1966 , y: 0.020},
{ x: 1967 , y: 0.030},
{ x: 1968 , y: 0.040},
Thanks !!!November 30, 2022 at 6:52 pm #40153Passing datapoints as an array of objects to chart options should work fine in your case. Please find the code-snippet given below.
var chartOptions1 = {
    animationEnabled: true,
    theme: "light2",
    title:{
      text: "1st Chart"
    },
    data: [{
      type: "splineArea",
      dataPoints: [
        { x: 1966 , y: 0.020},
        { x: 1967 , y: 0.025},
        { x: 1968 , y: 0.030},
        { x: 1969 , y: 0.050},
        { x: 1970 , y: 0.060},
        { x: 1971 , y: 0.070},
        { x: 1972 , y: 0.080},
        { x: 1973 , y: 0.050},
        { x: 1974 , y: 0.040},
        { x: 1975 , y: 0.020},
        { x: 1976 , y: 0.060},
        { x: 1977 , y: 0.060},
        { x: 1978 , y: 0.010},
        { x: 1979 , y: 0.030},
        { x: 1980 , y: 0.050},
        { x: 1981 , y: 0.010}
      ]
    }]
  };
.
.
.
Also, check out this JSFiddle for complete working code.
—-
Manoj Mohan
Team CanvasJSNovember 30, 2022 at 9:28 pm #40155Manoj,
Thank you very much, indeed, Now it works !
The only remaining detail is that zooming can’t be winded back with buttom
and zoomning works slightly different in the four graphs.December 1, 2022 at 3:05 am #40157Hi
After playing around I got the sync + zoom work,
One further question is how to get different high graphs – probably modifying these rows<style>
.row:after {
content: “”;
display: table;
clear: both;
}
.col {
float: left;
width: 100%;
height: 200px;
}
</style>I don’t know how to share the complete code
December 2, 2022 at 7:12 pm #40352The only remaining detail is that zooming can’t be winded back with buttom
and zoomning works slightly different in the four graphs.Please take a look at this updated JSFiddle which fixes the issue related to zooming.
One further question is how to get different high graphs
Can you kindly fork the JSFiddle and share it with us along with brief description about your requirement so that we can help you with an appropriate solution?
—-
Manoj Mohan
Team CanvasJS -
This topic was modified 5 years, 4 months ago by
Tagged: numeric data, Synchronize
You must be logged in to reply to this topic.