Home Forums Chart Support type:’line’ Chart on load browser goes to expire page or wait

type:’line’ Chart on load browser goes to expire page or wait

Viewing 4 posts - 1 through 4 (of 4 total)
  • #35987

    It took to memory and the tab is closed when loading bar graph and line chart both

    #35994

    @joineight,

    Rendering multiple charts in a page with different chart types seems to be working fine as shown in this documentation page. Can you kindly create a JSFiddle reproducing the issue you are facing and share it with us so that we can look into the code / chart-options being used, understand the scenario better, and help you out?

    Render Multiple Charts in a page

    ___________
    Indranil Deo
    Team CanvasJS

    #36007

    Hi
    Thanks for your response,
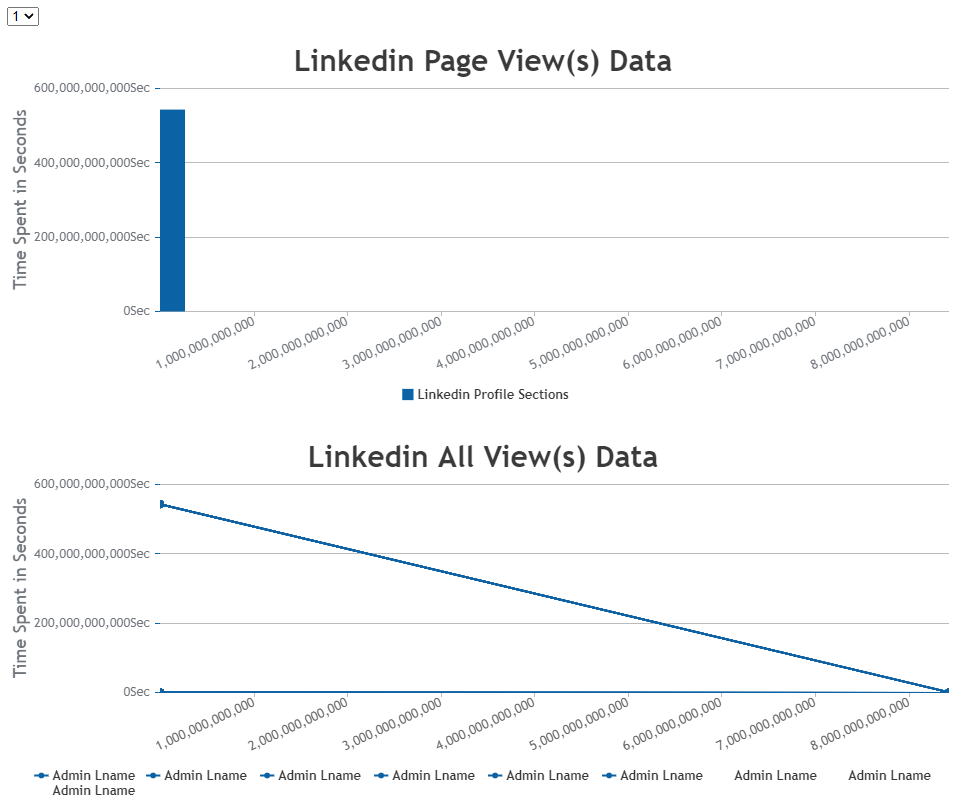
    I have added fiddle please have a look https://jsfiddle.net/qcsvu7h5/1/

    in a change of dropdown if I add more than or at load also from starting it takes too long and chrome got out of memory to stoppage

    But it works smoother if I add datapoint up to a limit of only 7 graph not more than that

    to reproduce my error go to this fiddle I have only change x and y-axis value and no of datapoints is increased
    I got an error in the fiddle when loading more but locally it for less data also

    https://jsfiddle.net/qcsvu7h5/4/
    https://jsfiddle.net/qcsvu7h5/3/
    https://jsfiddle.net/qcsvu7h5/2/

    In fiddle, I don’t know why and how working for lesser also as in first fiddle but in my system and server not working even first fiddle, it’s not working or in server also I have paid version still having the same issue

    Working condition :
    Datapoints less than 7
    Not working:
    Datapoints greater than 8

    #36023

    @joineight,

    As per the JSFiddle shared by you, we can observe that based on the range of y-axis and interval option the chart is rendering too many labels which is causing the browser to freeze. Hence, removing the interval option for y-axis will allow the library to auto-calculate the interval at which axis labels are to be displayed and it should work fine in your case. Please take a look at this updated JSFiddle.

    Chart with auto-calculated interval

    ___________
    Indranil Deo
    Team CanvasJS

Viewing 4 posts - 1 through 4 (of 4 total)

You must be logged in to reply to this topic.