@fulsdavid,
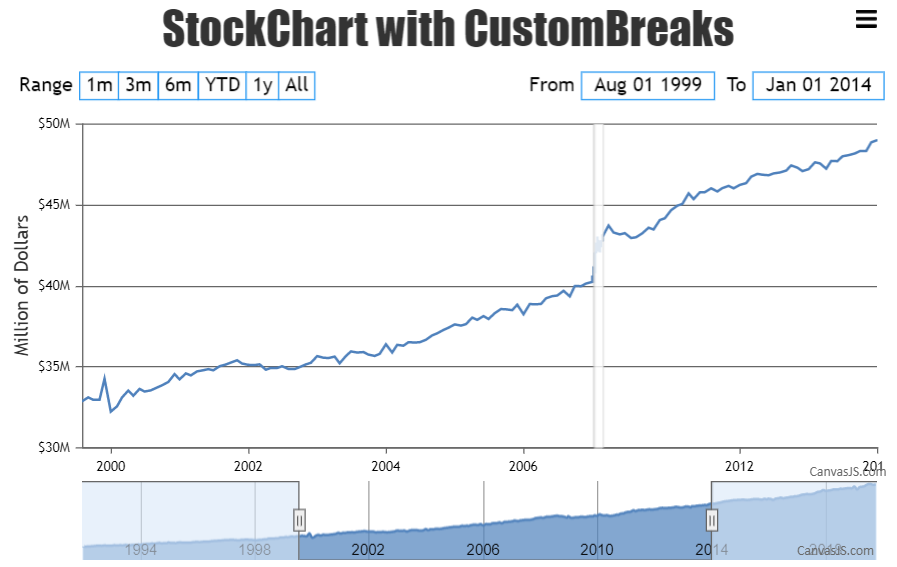
To add customBreaks in StockChart you can specify the startValue and endValue of the region to be shrunk on respective axis for each individual charts as shown in the code snippet below –
 var stockChart = new CanvasJS.StockChart("stockChartContainer", {
    title: {
      text:"StockChart with CustomBreaks"
    },
    .
    .
    charts: [{
      axisX: {
        scaleBreaks: {
          type: "straight",
          customBreaks: [{
            startValue: new Date(2007, 00, 01),
            endValue: new Date(2010, 00, 01)
          }]
        }
      },
      .
    }],
    .
    .
  });
Please check this JSFiddle for a working example on adding customBreaks in StockChart.
___________
Indranil Deo
Team CanvasJS
.