Login to Ask a Question or Reply
Forum Replies Created by Anjali
-
Andres,
Here is a modified version of our previous example where we generate JSON data using echo statements.
Below is the sample code
1. PHP Service to return JSON Data using echo statements:
<?php

	$conn = new mysqli("127.0.0.1","user","password", "chartDb");

	// Check connection
	if ($conn->connect_error) {
		die("Connection failed: " . $conn->connect_error);
	} else
	{
		$data_points = array();

		$result = mysqli_query($conn, "SELECT * FROM pie_chart");

		while($row = mysqli_fetch_array($result))
		{
			$point = array("label" => $row['Support'] , "y" => $row['yValues']);
			array_push($data_points, $point);
		}

		//echo json_encode($data_points, JSON_NUMERIC_CHECK);

		// JSON data using echo statements

		$length = sizeof($data_points);

		echo "[";
		for ( $i = 0; $i <= $length-1; $i++) {
			echo "{ \"label\": \"" , $data_points[$i]['label'],"\", \"y\": " , $data_points[$i]['y'], "}";
			if( $i < $length-1)
				echo ",";
		}
		echo "]";
	}
?>
2. HTML Page to Fetch Data and render Chart
<html>
<head>
<script src="jquery-1.11.1.min.js"></script>
<script src="canvasjs.min.js"></script>
<script type="text/javascript">
$(document).ready(function () {
	var dataPoints = [];
        $.getJSON("data.php", function (result) {
            var chart = new CanvasJS.Chart("chartContainer", {
                data: [
                    {
                        type: "pie",
                        dataPoints: result
                    }
                ]
            });
            chart.render();
        });
    });
</script>
</head>
<body>
       <div id="chartContainer" style="width:500px; height: 300px"></div>
</body>
</html>
__
Anjali-
This reply was modified 11 years, 8 months ago by
Anjali.
Niklas,
We are not able to reproduce the issue with given data. Can you please create a jsfiddle with sample data which reproduces the issue so that we can have a look? Till then, as a quick fix you can try setting axis minimum to zero.
__
AnjaliNiklas,
After rendering the chart you can update it by changing/updating its options property. We do not suggest creating new chart each time. You can update chart as shown below.
`chartObject.options.data[0].dataPoints = [array];
chartObject.render(); `and please refer to “Alternate way of setting / updating data” section of this article.
__
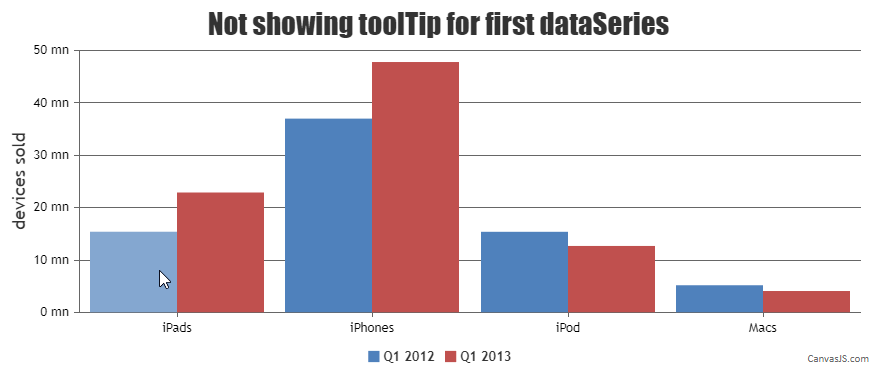
AnjaliYes, It is possible to not show the tool-tip for certain dataSeries alone.
You can do so by setting null to toolTipContent property of dataSeries for which you don’t want to show the tool-tip.Please take a look at the code snippet below,
      {
        type: "column",
	toolTipContent: null,
        showInLegend: true,
        name: "Apple Q1 2012",
        dataPoints: [
        {y: 15.40, label: "iPads" },
        {y: 37.00, label: "iPhones" },
        {y: 15.40, label: "iPod" },
        {y: 5.20, label: "Macs" }
        ]
      },
Kindly take a look at this JSFiddle for an example on not showing tool-tip for a specific data-series.
__
Anjali
Team CanvasJSAndres,
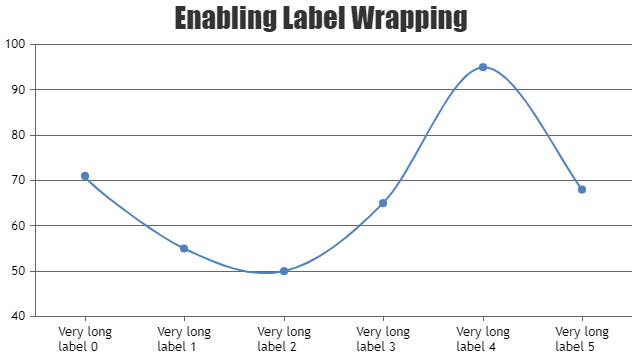
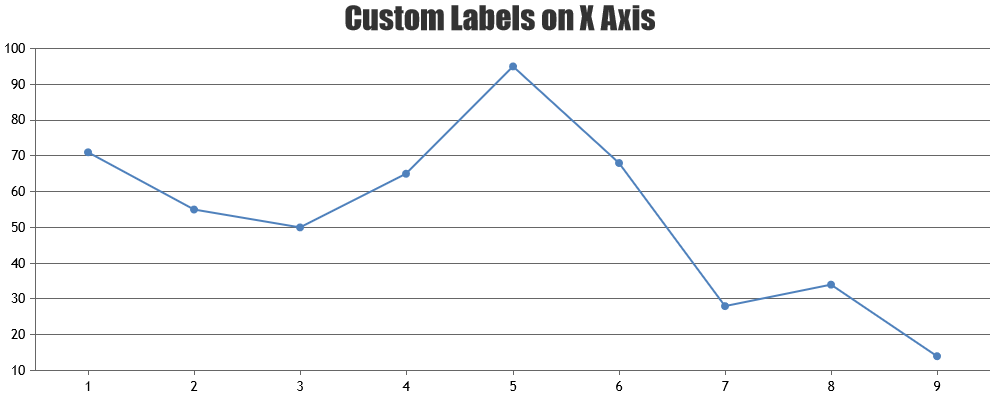
We looked into your JSON data and labels are null because of which it is not showing in second, third and fourth chart. When label is null, chart shows x-axis value at that point.
Here is the JSON data used by your second chart :
[{"label":null,"y":1},{"label":null,"y":45},{"label":null,"y":85}]In case of fifth chart, labels are overlapping because they are very long. You can avoid the same by wrapping labels as shown in the documentation page.
__
AnjaliAndres,
You just need to parse and modify your data as required. Below is an example.
var dataPoints = [];
	$.getJSON("tipus_recursos.php", function (result) {
		for(var i = 0; i <= result.length-1; i++) {
			dataPoints.push({label: result[i].Support, y: parseInt(result[i].y)});
		}
	var chart = new CanvasJS.Chart("chartContainer", {
		data: [
		{
			dataPoints: dataPoints
		}
		]
	});
	chart.render();
	});
__
AnjaliAndres,
In order to show labels you need to set label property of dataPoints. Here is the documentation on the same.
__
AnjaliChocamo,
As of now this feature is not available.
MMcCarty,
As of now, it is not possible.
__
AnjaliOctober 28, 2014 at 7:21 pm in reply to: CanvasJs donut chart size is different in second slide of Bootstrap3 carousel #7403Hi,
After calculating the height and width of Carousel DOM element, you are not setting these values as the height and width of Chart because of which it is rendering with default (500*400) width & height.
You can check out this jsfiddle.
Also please do not set CSS on canvas elements directly. Instead you should set styles for Chart Container.
__
AnjaliHi,
In your JSON data y-value contains string data (in quotes) while CanvasJS requires numbers. So you basically need to parse those strings before assigning.
Here, is how you can do the same.
$(document).ready(function () {
var dataPoints = [];
$.getJSON("jsonparser.php", function (result) {
for (var i = 0; i < result.length; i++) {
	dataPoints.push({x: result[i].x, y: parseFloat(result[i].y)})
};
var chart = new CanvasJS.Chart("chartContainer", {
data: [
{ type:'line',
dataPoints: dataPoints
}
]
});
chart.render();
});
});
__
AnjaliDennisnguy,
As of now, only primary and secondary y-axis are supported.
__
AnjaliAs of now setting minimum/maximum is the only way.
I set minimum and maximum like minimum : new Date (2014,….)
It’s work, but I can’t zoom inside this selection.This is a bug and we’ll fix the issue in the next release. But we do have a workaround though. Setting timestamp instead of date object works fine. Below is the code snippet.
axisX: {
    minimum: (new Date(2002,00,1)).getTime(),
    maximum: (new Date(2002,00,20)).getTime()
}
—
Anjali Jain -
This reply was modified 11 years, 8 months ago by