Login to Ask a Question or Reply
You must be logged in to post your query.
Home › Forums › Chart Support › Issues retrievng data from MySql
Issues retrievng data from MySql
- This topic has 29 replies, 3 voices, and was last updated 11 years, 7 months ago by
andres.chandia.
-
October 30, 2014 at 6:50 pm #7421
Hi there, I have followed one of the answers you gave about retrieving data from MySql DB and I did it successfully, but I have some issues with some of the graphics, all of them regarding labels.
First, here you can find my graphics: http://parles.upf.edu/llocs/adljc/grafics/
You will see in this page 5 little graphics, clicking on the magnifying glass you can see a larger version of them.
1st one, no problem at all.
2nd, “Tipus de recursos” (Pie): no labels at all, here’s the code for this graphic:
file graf_tipus_recursos.php (not all the code, only the part that matters)<script src="jquery.js"></script> <script src="canvasjs.js"></script> <script src="tipus_recursos.js"></script> </head> <body> <div id="chartContainer2" style="width: 1200px; height: 700px;" ></div>file tipus_recursos.js
$(document).ready(function () {
            $.getJSON("tipus_recursos.php", function (result) {
                var chart = new CanvasJS.Chart("chartContainer2", {
                    data: [
                        {
                            type: "pie",
                            dataPoints: result
                        }
                    ]
                });
                chart.render();
            });
        });
file tipus_recursos.php
<?php
header('Content-Type: application/json');
$con = mysqli_connect("localhost","user","password","database");
if (mysqli_connect_errno($con))
{
    echo "Failed to connect to DataBase: " . mysqli_connect_error();
}else
{
    $data_points = array();
    $result = mysqli_query($con, "SELECT Tipus_1 AS Tipus, COUNT(*) AS 'Count' FROM values GROUP BY Tipus_1 ORDER BY Count");
    while($row = mysqli_fetch_array($result))
    {
        $point = array("label" => $row['Tipus_1'] , "y" => $row['Count']);
        array_push($data_points, $point);
    }
    echo json_encode($data_points, JSON_NUMERIC_CHECK);
}
mysqli_close($con);
?>
There is no difference between the queries of the first graphic and this one, except for the field requested.
It happens the same with graphics 3 “Recursos lingüístics” and 4 “Recursos jurídics” with the difference that in these two the tags take numeric values while they should be names.5th graphic, “Tipus de suport”: well this is kind of weird, at the little version labels can be seen, overlapping each other, but they are there, while viewing the large version, labels at the x axis are replaced by numbers but they remain when hovering the columns.
So here I add a question; My table is somthing like this:
| id | Title | Support |
——————————–
| 1 | First | Internet |
| 2 | Second | Paper |
| 3 | Third | CD |
| 4 | Fourth | Paper,CD |
| 5 | Fifth | Internet,Paper |So I would like to render a Graph with 3 columns only, Internet, Paper, CD
for each column the query should be like:$query1: "SELECT Support, COUNT(*) AS 'Count1' FROM table WHERE Support LIKE '%paper%'; $query2: "SELECT Support, COUNT(*) AS 'Count2' FROM table WHERE Support LIKE '%internet%'; $query3: "SELECT Support, COUNT(*) AS 'Count3' FROM table WHERE Support LIKE '%CD%';So the question is, how do I make fit all of this to have the required graph, I’ve already tried a lot of combinations unsuccessfully, I would appreciatea a lot if you can heklp me on this….
Thanks a lot
-
This topic was modified 11 years, 8 months ago by
-
This topic was modified 11 years, 8 months ago by
-
This topic was modified 11 years, 8 months ago by
-
This topic was modified 11 years, 8 months ago by
October 31, 2014 at 3:42 pm #7446Andres,
In order to show labels you need to set label property of dataPoints. Here is the documentation on the same.
__
AnjaliOctober 31, 2014 at 5:38 pm #7449Thanks for answering, but I only see parameters for static data, how do I apply this to dynamic data, I mean, retrieved from mysql dtabase.
and thanks again man.October 31, 2014 at 6:20 pm #7450Andres,
You just need to parse and modify your data as required. Below is an example.
var dataPoints = [];
	$.getJSON("tipus_recursos.php", function (result) {
		for(var i = 0; i <= result.length-1; i++) {
			dataPoints.push({label: result[i].Support, y: parseInt(result[i].y)});
		}
	var chart = new CanvasJS.Chart("chartContainer", {
		data: [
		{
			dataPoints: dataPoints
		}
		]
	});
	chart.render();
	});
__
AnjaliOctober 31, 2014 at 7:50 pm #7451No luck, it renders in the same way, without the lables…
here is the query:
$data_points = array();
    $result = mysqli_query($con, "SELECT Tipus_1 AS Tipus, COUNT(*) AS 'Count' FROM values GROUP BY Tipus_1 ORDER BY Count");
    while($row = mysqli_fetch_array($result))
    {
        $point = array("label" => $row['Tipus_1'] , "y" => $row['Count']);
        array_push($data_points, $point);
    }
    echo json_encode($data_points, JSON_NUMERIC_CHECK);
here is the js file:
var dataPoints = []; $.getJSON("tipus_recursos.php", function (result) { for(var i = 0; i <= result.length-1; i++) { dataPoints.push({label: result[i].Tipus_1, y: parseInt(result[i].y)}); } var chart = new CanvasJS.Chart("chartContainer2", { data: [ { type: "pie", dataPoints: dataPoints } ] }); chart.render(); });-
This reply was modified 11 years, 8 months ago by
November 3, 2014 at 12:39 pm #7455Andres,
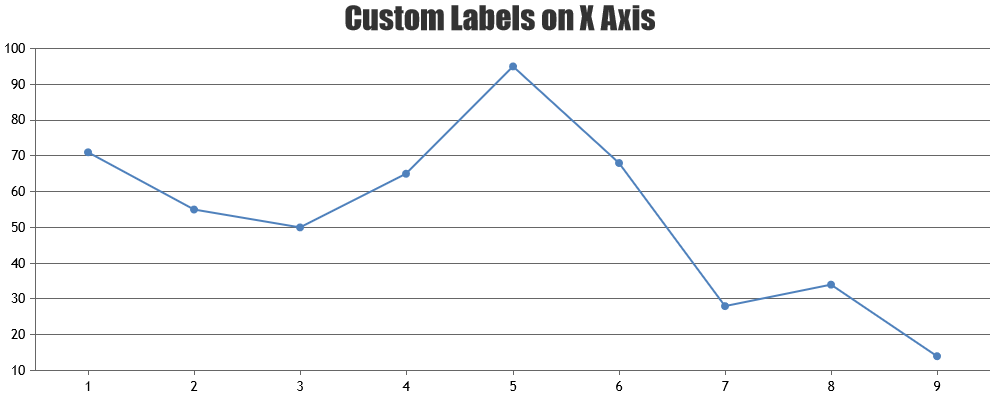
We looked into your JSON data and labels are null because of which it is not showing in second, third and fourth chart. When label is null, chart shows x-axis value at that point.
Here is the JSON data used by your second chart :
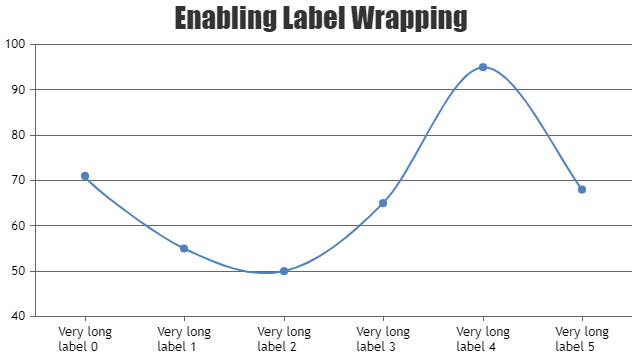
[{"label":null,"y":1},{"label":null,"y":45},{"label":null,"y":85}]In case of fifth chart, labels are overlapping because they are very long. You can avoid the same by wrapping labels as shown in the documentation page.
__
AnjaliNovember 3, 2014 at 3:14 pm #7456Thanks Anjali,
I have tried before with another graphic generator http://parles.upf.edu/llocs/adljc/grafics.old/ and if you check those you will see that x axis labels are generated, not pretty well, but the labels are there because the data is actually there.
At the pie graphic you will see the labels have encoding issues, but they are there, could this be the reason for canvas not showing labels, my data is in utf-8 and words have accents…Queries are the same, it’s only the way of generating the graphic that is different, it’s a php library: http://www.ebrueggeman.com/phpgraphlib
Actually, both graphics (phplib and canvasjs) are currently generated form the exact same data, I preffer canvas because it is visually better than the other.
So why could be json showing as null when the fields are actually not.
November 3, 2014 at 4:57 pm #7458Just in case, i’m adding the table structure
— phpMyAdmin SQL Dump
— version 4.2.6deb1
— http://www.phpmyadmin.net
—
— Servidor: localhost
— Tiempo de generación: 03-11-2014 a las 12:23:46
— Versión del servidor: 5.5.40-0ubuntu1
— Versión de PHP: 5.5.12-2ubuntu4.1SET SQL_MODE = “NO_AUTO_VALUE_ON_ZERO”;
SET time_zone = “+00:00”;/*!40101 SET @OLD_CHARACTER_SET_CLIENT=@@CHARACTER_SET_CLIENT */;
/*!40101 SET @OLD_CHARACTER_SET_RESULTS=@@CHARACTER_SET_RESULTS */;
/*!40101 SET @OLD_COLLATION_CONNECTION=@@COLLATION_CONNECTION */;
/*!40101 SET NAMES utf8 */;—
— Base de datos:database
—— ——————————————————–
—
— Estructura de tabla para la tablavalues
—CREATE TABLE IF NOT EXISTS
values(
Idint(6) NOT NULL,
Titolvarchar(500) DEFAULT NULL,
Autorvarchar(200) DEFAULT NULL,
Any_publicacioint(4) NOT NULL,
Pub_prodvarchar(200) DEFAULT NULL,
Lloc_publicaciovarchar(200) DEFAULT NULL,
Suportvarchar(200) DEFAULT NULL,
Consulta_liniavarchar(10) NOT NULL,
D_actualitzaciovarchar(10) NOT NULL,
Urlvarchar(500) NOT NULL,
Tipus_1set(‘lingüístic’,’jurídic’) NOT NULL,
Tipus_2varchar(1000) NOT NULL,
Tipus_3varchar(1000) NOT NULL,
P_clauvarchar(1000) NOT NULL
) ENGINE=InnoDB DEFAULT CHARSET=utf8 AUTO_INCREMENT=132 ;—
— Índices para tablas volcadas
——
— Indices de la tablavalues
—
ALTER TABLEvalues
ADD PRIMARY KEY (Id), ADD UNIQUE KEYid(Id);—
— AUTO_INCREMENT de las tablas volcadas
——
— AUTO_INCREMENT de la tablavalues
—
ALTER TABLEvalues
MODIFYIdint(6) NOT NULL AUTO_INCREMENT,AUTO_INCREMENT=132;
/*!40101 SET CHARACTER_SET_CLIENT=@OLD_CHARACTER_SET_CLIENT */;
/*!40101 SET CHARACTER_SET_RESULTS=@OLD_CHARACTER_SET_RESULTS */;
/*!40101 SET COLLATION_CONNECTION=@OLD_COLLATION_CONNECTION */;-
This reply was modified 11 years, 8 months ago by
-
This reply was modified 11 years, 8 months ago by
-
This reply was modified 11 years, 8 months ago by
November 3, 2014 at 6:05 pm #7462Andres,
At the pie graphic you will see the labels have encoding issues, but they are there, could this be the reason for canvas not showing labels, my data is in utf-8 and words have accents…
CanvasJS doesn’t have any issue rendering Accented Characters. Problem is that JSON that you are generating doesn’t have label values set – labels are null in case of 2nd, 3rd and 4th chart’s JSON data.
Given that JSON data of first chart has labels set properly, you can compare that code with that of 2nd chart’s JSON generating code (on the server side).
—
Sunil UrsNovember 3, 2014 at 6:31 pm #7463I have compare them, and the only difference I find is in the query file not in the js one…
file any_publicacio.js (the one that correctly shows the labels)$(document).ready(function () { $.getJSON("any_publicacio.php", function (result) { var chart = new CanvasJS.Chart("chartContainer1", { data: [ { dataPoints: result } ] }); chart.render(); }); });File tipus_recursos.js this one does not shows the labels
$(document).ready(function () {
            $.getJSON("tipus_recursos.php", function (result) {
                var chart = new CanvasJS.Chart("chartContainer2", {
                    data: [
                        {
                                type: "pie",
                            dataPoints: result,
                                indexLabel: "#percent"
                        }
                    ]
                });
                chart.render();
            });
        });
query of the first one, the one that works, file any_publicacio.php
$data_points = array();
    $result = mysqli_query($con, "SELECT <code>Any_publicacio</code>, COUNT(*) AS 'Publicacions' FROM <code>values</code> GROUP BY <code>Any_publicacio</code> DESC");
    while($row = mysqli_fetch_array($result))
    {
        $point = array("label" => $row['Any_publicacio'] , "y" => $row['Publicacions']);
        array_push($data_points, $point);
    }
    echo json_encode($data_points, JSON_NUMERIC_CHECK);
query of the second one, the one that does not shows de labels: tipus_recursos.php
$data_points = array();
    $result = mysqli_query($con, "SELECT <code>Tipus_1</code> AS Tipus, COUNT(*) AS 'Recursos' FROM <code>values</code> GROUP BY <code>Tipus_1</code> DESC");
    while($row = mysqli_fetch_array($result))
    {
        $point = array("label" => $row['Tipus_1'] , "y" => $row['Recursos']);
        array_push($data_points, $point);
    }
    echo json_encode($data_points, JSON_NUMERIC_CHECK);
The difference in the query is that in the second one I have to put “AS Tipus” otherwise graphic does not renders
November 5, 2014 at 4:35 pm #7473Hi there, any clue yet?
November 5, 2014 at 5:26 pm #7474Andres,
Issue might be one of the two
1. $row[‘Tipus_1’] values are null – can you confirm this by logging (echoing) those values??
2. json_encode is not encoding. What is the type of data??In case json_encode has some issue encoding the data, try creating the entire json data using echo statements and string concatination. If you can get those values to show up in JSON data chart will automatically render them.
—
Sunil UrsNovember 5, 2014 at 7:34 pm #7475Ok, at this file: http://parles.upf.edu/llocs/adljc/grafics/graf_tipus_recursos.php I have put this query:
SELECTTipus_1AS 'Tipus', COUNT(*) AS 'Recursos' FROMvaluesGROUP BYTipus_1DESCYou can see the resulting table under the graphic.
The complete code for rendering the table is this one:
<?php
include ("../admin/dbconnect.php");
$query= "SELECT <code>Tipus_1</code> AS 'Tipus', COUNT(*) AS 'Recursos' FROM <code>values</code> GROUP BY <code>Tipus_1</code> DESC";
$result = mysql_query($query);
if (!$result) {
    die("Query to show fields from table failed");
}

$fields_num = mysql_num_fields($result);

echo "<table class='sortable'><tr>";

// printing table headers
for($i=0; $i<$fields_num; $i++)
{
    $field = mysql_fetch_field($result);
    echo "<td align=center>".strtr(" {$field->name} ", $transname)."</td>";
}
echo "</tr>\n";
// printing table rows

while($row = mysql_fetch_row($result))
{
    echo "<tr onMouseOver=this.bgColor='#e0e0e7'; onMouseOut=this.bgColor='white';>";

    // $row is array... foreach( .. ) puts every element
    // of $row to $cell variable
    foreach($row as $cell)
        echo "<td align=center>$cell</td>";
    echo "</tr>\n";
}
mysql_free_result($result);
?>
2. Type of data: Tipus_1 set(‘lingüístic’,’jurídic’) NOT NULL,
November 5, 2014 at 7:38 pm #7476In case json_encode has some issue encoding the data, try creating the entire json data using echo statements and string concatination. If you can get those values to show up in JSON data chart will automatically render them.
Sorry but that sounds like chinese to me….
November 5, 2014 at 7:45 pm #7477 -
This topic was modified 11 years, 8 months ago by
You must be logged in to reply to this topic.