Login to Ask a Question or Reply
Forum Replies Created by Anjali
-
dberg,
This feature is not available yet and we are considering the same for future versions.
[Update]
This feature is available since V1.8.1.__
Anjalidberg,
The issue has been fixed in the current version – v1.7.0 GA. Please download it from our download page and let me know if its working as expected.
__
Anjali JainHello,
After looking into your code we found couple of issues. Please correct the below mentioned issues:
1) You are adding both the series inside same object while they should be two different objects as shown below.
`[
{
“type”: “line”,
“showInLegend”: “true”,
“name”: “name1”,
“dataPoints”: [
{ “x”: “2015-3-01”, “y”: 34 },
{ “x”: “2015-4-01”, “y”: 41 },
{ “x”: “2015-5-01”, “y”: 23.800000026822 }
]
},
{
“type”: “line”,
“showInLegend”: “true”,
“name”: “name2”,
“dataPoints”: [
{ “x”: “2015-2-01”, “y”: 14 },
{ “x”: “2015-3-01”, “y”: 37 },
{ “x”: “2015-4-01”, “y”: 39.20000000298 },
{ “x”: “2015-5-01”, “y”: 50.10000000149 }
]
}
]`2) In your JSON data, x values are in string form which you need to convert back to Number/Date before assigning it to the chart as shown below.
function displayChart(data) {
	for (var i = 0; i <= data.length - 1; i++) {
		var dataPointss = [];
		for (var j = 0; j <= data[i].dataPoints.length - 1; j++) {
			dataPointss.push({ x: new Date(data[i].dataPoints[j].x), y: data[i].dataPoints[j].y });
		}
		data[i].dataPoints = dataPointss;
		chart.options.data[i] = data[i];
	}
	chart.render();
}
Below is the code with issue fixed:
var chart = new CanvasJS.Chart("chartContainer",
{
	zoomEnabled: false,
	animationEnabled: true,
	title:{
		text: "PROJECTS"
	},
	axisY2:{
		valueFormatString:"0.0 days",
		interlacedColor: "#F5F5F5",
		gridColor: "#D7D7D7",
		tickColor: "#D7D7D7"
	},
	theme: "theme2",
	toolTip:{
		shared: true
	},
	legend:{
		verticalAlign: "bottom",
		horizontalAlign: "center",
		fontSize: 15,
		fontFamily: "Lucida Sans Unicode",
		cursor:"pointer",
		itemclick : function(e) {
		if (typeof(e.dataSeries.visible) === "undefined" || e.dataSeries.visible) {
			e.dataSeries.visible = false;
		}
		else {
			e.dataSeries.visible = true;
		}
		chart.render();
		}
	},
	data: []
});

function displayChart(data) {
	for (var i = 0; i <= data.length - 1; i++) {
		var dataPointss = [];
		for (var j = 0; j <= data[i].dataPoints.length - 1; j++) {
			dataPointss.push({ label: data[i].dataPoints[j].x, y: data[i].dataPoints[j].y });
		}
		data[i].dataPoints = dataPointss;
		chart.options.data[i] = data[i];
	}
	chart.render();
}

function1();

function function1(){
	return $.ajax({
		type: "GET",
		url: "data1.js",
		dataType: "json",
		error: function(){
			alert("impossible de chercher ce project");
		},
		success: function (json) { displayChart(json); }
	});
}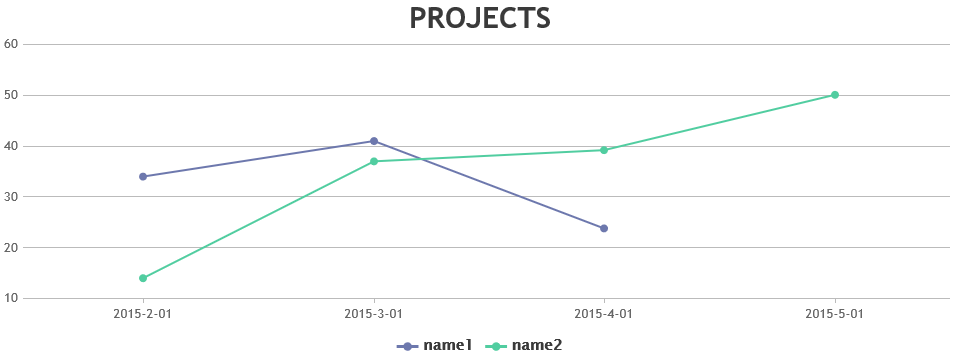
__
Anjalidberg,
Thanks for reporting the issue. We will fix it at the earliest.
__
AnjaliWithout knowing the JSON data its not possible to figure out the issue. Can you please post a sample JSON response?
__
AnjaliHello,
We just tried your code with above provided data and chart is rendering properly. Can you let us know if you are getting any error in the console??
__
Anjalishvan,
Can you please create a jsfiddle with your sample data so that we can have a look ?
__
Anjalishvan,
Code contains relative link to canvasjs.min.js on our server. Hence it won’t work unless you download the same and set proper path. Please download the latest version and try again.
__
Anjalisid,
You can do the same by using different y-axis for both the lines as shown in this example.
__
Anjalimugenheimer,
Can you please post your JSON response here so that we can figure out the issue.
__
Anjalisid,
Can you please create a jsfiddle which reproduce the issue. While creating JSFiddle you can hard code your CSV file as a string and parse the same.
__
AnjaliClow,
After looking into your code we have come across few issues in your code which are mentioned below :
1) Before creating a chart object you are trying to assign result to it’s options
chart.options.data[0].dataPoints = result;Which will throw an error “Uncaught TypeError: Cannot read property ‘options’ of undefined”.2) Before making an AJAX request you are not including jQuery file which will throw an error “Uncaught ReferenceError: $ is not defined”.
3) The way you are assigning result as well hard coded data to dataPoints is syntactically wrong
Please refer to the below code with issue fixed:
<!DOCTYPE html>
<html>
<head>
<title></title>
<script src="https://canvasjs.com/assets/script/jquery-1.11.1.min.js"></script>
<script src="https://cdn.canvasjs.com/canvasjs.min.js"></script>
<script>
window.onload = function () {
	$.getJSON("data.php", function (result) {
		var chart = new CanvasJS.Chart("chartContainer", {
			axisX: {
				title: "Weeks",
				//interval: 1,
				//intervalType: "day",
				labelAngle: -45
			},
			axisY: {
				title: "Percentage",
			},
			data: [
			{
				type: "spline",
				dataPoints: result
			}
			],
			legend: {
				cursor: "pointer",
				itemclick: function (e) {
					if (typeof (e.dataSeries.visible) === "undefined" || e.dataSeries.visible) {
						e.dataSeries.visible = false;
					} else {
						e.dataSeries.visible = true;
					}
					chart.render();
				}
			}
		});
		chart.render();
	});
}
</script>
</head>
<body>
	<div id="chartContainer" style="width: 50%; height: 300px"></div>
</body>
</html>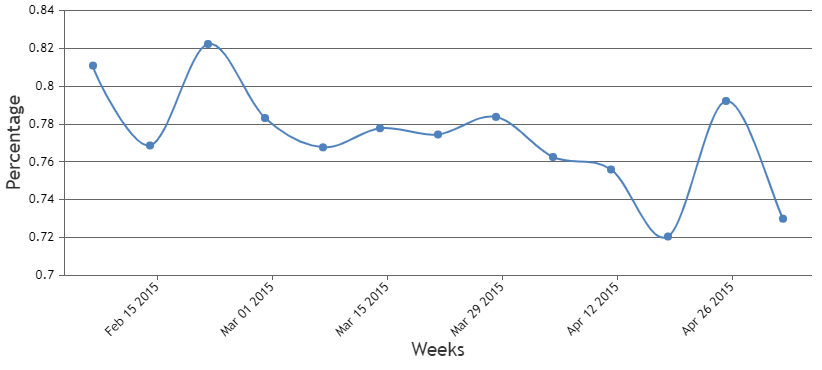
__
AnjaliPalli,
We just looked into your code and it turns out you are not clearing/resetting the dataPoints before assigning new values to it. You can do so by assigning a new empty array as shown below.
chart.options.data[0].dataPoints = [];
for(var i = 1 ; i < xtmax; i++) {
  xtime += 1;
  kt = Ratek1*xtime;
  Aconct=Aconct0*Math.exp(-kt);
  chart.options.data[0].dataPoints[i-1] = {x:xtime, y:Aconct};
};
chart.render();
chart.options.data[1].dataPoints = []; for(var i = 1 ; i < xtmax; i++) { xtime += 1; Aconct0kt1 = 1+(Aconct0*Ratek2*xtime); Aconct2=Aconct0/Aconct0kt1; chart.options.data[1].dataPoints[i-1] = {x:xtime, y:Aconct2} }; chart.render(); });Hello,
Thanks for reporting the issue. We will try to reproduce the same and get back at the earliest.
__
Anjalicivilian0746,
That makes sense. Thanks for your suggestion. We’ll fix the same in the next version.
__
Anjali