Login to Ask a Question or Reply
Forum Replies Created by Anjali
-
nivux,
We’ve sent you an internal build over email along with examples.
__
Anjali-
This reply was modified 11 years ago by
Anjali.
bluesky,
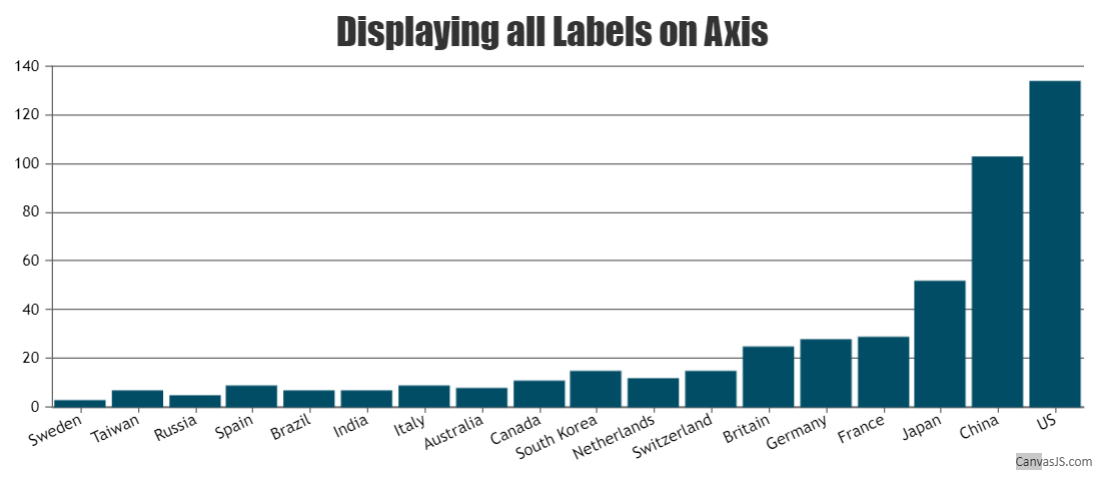
Chart skips some of the labels to avoid overlapping. But you can force it to show all labels by setting interval property of axisX to 1. Below is the code snippet –
axisX:{
   interval: 1
}
Please take a look at this JSFiddle for a working example.
__
Anjalitimverbruggen,
Sorry, as of now we do not have any plans to implement 3D charts.
__
AnjaliNimal,
Can you please provide a sample JSON data so that we can suggest a solution.
__
Anjalialexander,
These feature are not available as of now. We do have plans to implement feature to control Doughnut Thickness. But we don’t have a timeline for it yet.
__
Anjalistuart,
In your csv file you have dateTime values which you are assigning to label property. Instead you should be assign dateTime values to x-value which can be done as shown below :
<!DOCTYPE html>
<html>
<head>
    <title>Test</title>
    <meta http-equiv="Content-Type" content="text/html; charset=utf-8">
    <script src="https://canvasjs.com/assets/script/jquery-1.11.1.min.js"></script>
    <script type="text/javascript">
        $(document).ready(function () {

            var dataPoints1 = [];
            var dataPoints2 = [];

            $.ajax({
                type: "GET",
                url: "http://www.cuedup.biz/vgraphing/demoui/BT01.csv",
                dataType: "text",
                success: function (data) { processData1(data); }
            });

            function processData1(allText) {
                var allLinesArray = allText.split('\n');
                if (allLinesArray.length > 0) {
                    for (var i = 0; i <= allLinesArray.length - 2; i++) {
                        var rowData = allLinesArray[i].split(',');

                        var labelData = rowData[0].split(":");

                        if( labelData[2] === undefined )
                            labelData[2] = 0;

                        labelData[0] = parseInt(labelData[0]);
                        labelData[1] = parseInt(labelData[1]);
                        labelData[2] = parseInt(labelData[2]);

                        if (rowData.length >= 2)
                            dataPoints1.push({ x: new Date(2012, 1, 1, labelData[0], labelData[1], labelData[2]), y: parseInt(rowData[1]) });
                    }
                }
              requestTempCsv();
            }

           function requestTempCsv() {
                $.ajax({
                    type: "GET",
                    url: "http://www.cuedup.biz/vgraphing/demoui/GP01.csv",
                    dataType: "text",
                    success: function (data) { processData2(data); }
                });
           }

            function processData2(allText) {
                var allLinesArray = allText.split('\n');
                if (allLinesArray.length > 0) {

                    for (var i = 1; i <= allLinesArray.length - 1; i++) {
                        var rowData = allLinesArray[i].split(',');
                        var labelData = rowData[0].split(":");

                        if (labelData[2] === undefined)
                            labelData[2] = 0;

                        labelData[0] = parseInt(labelData[0]);
                        labelData[1] = parseInt(labelData[1]);
                        labelData[2] = parseInt(labelData[2]);

                        if (rowData.length >= 2)
                            dataPoints2.push({ x: new Date(2012, 1, 1, labelData[0], labelData[1], labelData[2]), y: parseInt(rowData[1]) });

                    }
                    drawChart(dataPoints1, dataPoints2);
                }
            }

            function drawChart(dataPoints1, dataPoints2) {
                var chart = new CanvasJS.Chart("GP01", {
                    theme: "theme2",
                    title: {
                        text: "Master bedroom temperature and heating demand"
                    },
                    zoomEnabled: true,
                    data: [
                    {
                        type: "stepLine",
                        dataPoints: dataPoints1
                    },
                    {
                        type: "spline",
                        dataPoints: dataPoints2
                    }

                    ]
                });
                chart.render();
            }
        });

    </script>
    <script type="text/javascript" src="https://cdn.canvasjs.com/canvasjs.min.js"></script>
</head>
<body>
<div id="GP01" style="height: 300px; width:100%;"></div>
</body>
</html>
__
AnjaliHello,
In your csv file you have dateTime values which you are assigning to label property. Instead you should be using dateTime values which can be done as shown below :
<!DOCTYPE html>
<html>
<head>
    <title>Test</title>
    <meta http-equiv="Content-Type" content="text/html; charset=utf-8">
    <script src="jquery-1.8.0.js"></script>
    <script type="text/javascript">
        $(document).ready(function () {

            var dataPoints1 = [];
            var dataPoints2 = [];

            $.ajax({
                type: "GET",
                url: "http://www.cuedup.biz/vgraphing/demoui/BT01.csv",
                dataType: "text",
                success: function (data) { processData1(data); }
            });

            function processData1(allText) {
                var allLinesArray = allText.split('\n');
                if (allLinesArray.length > 0) {
                    for (var i = 0; i <= allLinesArray.length - 2; i++) {
                        var rowData = allLinesArray[i].split(',');

                        var labelData = rowData[0].split(":");

                        if( labelData[2] === undefined )
                            labelData[2] = 0;

                        labelData[0] = parseInt(labelData[0]);
                        labelData[1] = parseInt(labelData[1]);
                        labelData[2] = parseInt(labelData[2]);

                        if (rowData.length >= 2)
                            dataPoints1.push({ x: new Date(2012, 1, 1, labelData[0], labelData[1], labelData[2]), y: parseInt(rowData[1]) });
                    }
                }
              requestTempCsv();
            }

           function requestTempCsv() {
                $.ajax({
                    type: "GET",
                    url: "http://www.cuedup.biz/vgraphing/demoui/GP01.csv",
                    dataType: "text",
                    success: function (data) { processData2(data); }
                });
           }

            function processData2(allText) {
                var allLinesArray = allText.split('\n');
                if (allLinesArray.length > 0) {

                    for (var i = 1; i <= allLinesArray.length - 1; i++) {
                        var rowData = allLinesArray[i].split(',');
                        var labelData = rowData[0].split(":");

                        if (labelData[2] === undefined)
                            labelData[2] = 0;

                        labelData[0] = parseInt(labelData[0]);
                        labelData[1] = parseInt(labelData[1]);
                        labelData[2] = parseInt(labelData[2]);

                        if (rowData.length >= 2)
                            dataPoints2.push({ x: new Date(2012, 1, 1, labelData[0], labelData[1], labelData[2]), y: parseInt(rowData[1]) });

                    }
                    drawChart(dataPoints1, dataPoints2);
                }
            }

            function drawChart(dataPoints1, dataPoints2) {
                var chart = new CanvasJS.Chart("GP01", {
                    theme: "theme2",
                    title: {
                        text: "Master bedroom temperature and heating demand"
                    },
                    zoomEnabled: true,
                    data: [
                    {
                        type: "stepLine",
                        dataPoints: dataPoints1
                    },
                    {
                        type: "spline",
                        dataPoints: dataPoints2
                    }

                    ]
                });
                chart.render();
            }
        });

    </script>
    <script type="text/javascript" src="canvasjs.js"></script>
</head>
<body>
<div id="GP01" style="height: 300px; width:100%;"></div>
</body>
</html>
__
Anjali[Update]
Now we have a Tutorial on Creating Charts from JSON Data in our documentation.
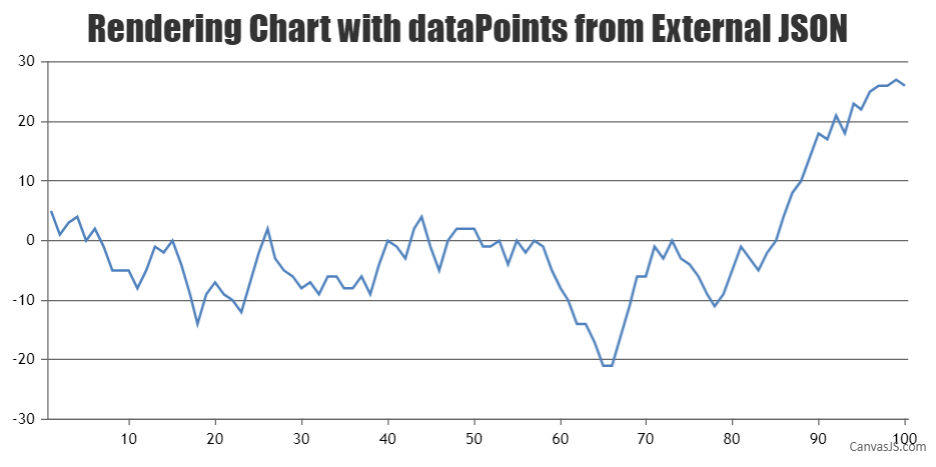
Hello,
You need to create a HTML page that does AJAX request and fetch the data. After getting the data, it will render a Chart. Please refer the below mentioned code :
<html> <head> <script type="text/javascript" src="https://canvasjs.com/assets/script/jquery-1.11.1.min.js"></script> <script type="text/javascript" src="https://cdn.canvasjs.com/canvasjs.min.js"></script> <script type="text/javascript"> $(document).ready(function () { var dataPoints = []; var chart = new CanvasJS.Chart("chartContainer", { title: { text: "Basic Column Chart" }, data: [ { dataPoints: [] }] }); // Ajax request for getting JSON data //Replace data.php with your JSON API's url $.getJSON("data.php", function (data) { for (var i = 0; i < data.length; i++) { dataPoints.push({ label: data[i].source, y: data[i].sourcecount }); } chart.options.data[0].dataPoints = dataPoints; chart.render(); }); }); </script> </head> <body> <div id="chartContainer" style="width: 50%; height: 300px;"></div> </body> </html>laurenth,
This is not possible as of now. But you can consider using stackedColumn chart instead.
____
AnjaliThanks for your suggestion. We will consider this for future versions.
__
Anjaligiancocietto,
Without looking into your JSON data it’s hard to guess the problem so please post your JSON response here so that we can have a look ?
__
Anjalidaniel,
We are considering gauge chart for future versions but we don’t have exact timeline.
__
Anjali -
This reply was modified 11 years ago by