Login to Ask a Question or Reply
Forum Replies Created by Anjali
-
Hi,
We don’t have stacked step area chart in our roadmap but we will consider in future.
__
Anjali JainSrikanth,
RespondJS is being used to make our website(Bootstrap based) work with IE8 and it doesn’t work perfectly all the time. So the problem is with the website and not the Charting Library itself. So you can download the library and use it at your end – it should work fine on IE8.
—
Anjali[update]
We have just released v1.9.6 Beta with Methods & Properties, which allows you to programmatically export chart as image, print chart, access internally calculated values, etc. Please refer to the release blog for more information.
Swapnil,
We currently don’t have a way to access minimum and maximum values that are auto calculated. At the same time we think the chart should not override the values initially set by the user while zooming – which defeats the purpose of setting minimum and maximum (by users). Hence we don’t intend to implement the same.
—
AnjaliHi,
Yes, we can surely help you with that. Before that can you please post your code along with the json data so we can have a look.
__
AnjaliHi,
For doing the same, you can use the chart properties inside the mouse events and call chart.render(). Here, is an example. But we’ll surely consider making this the default behavior in future versions.
—
AnjaliHi,
For doing the same, set the valueFormatString to empty string inside axisX and assign the formatted date to the label. Here is an example.
For formatting dateTime values you can use Either use MomentJS or assign it directly on the server side too.
because in responsive (resolution < 768px) gets a mess
Just want to know what is going wrong when resolution is < 768px. Can you please create a JSFiddle so that we can have a look. As long as you have not set interval property, it should automatically adjust to any screen size. Try changing window size in this example.
—
Anjali-
This reply was modified 11 years, 10 months ago by
Anjali.
Hi,
CanvasJs Expects the value to be integer – stings are not parsed automatically. So you’ll have to parse y values before assigning. Below is how you can do the same.
$(document).ready(function () {
	var dataPoints = [];
	$.getJSON("data1.php", function (result) {
		for(var i = 0; i <= result.length-1; i++) {
			dataPoints.push({label: result[i].label, y: parseInt(result[i].y)});
		}
	var chart = new CanvasJS.Chart("chartContainer", {
		data: [
		{
			dataPoints: dataPoints
		}
		]
	});
	chart.render();
	});
});
__
AnjaliHi,
You avoid that flicker by setting width and height of chart to it’s container’s dimensions. By doing so you won’t have to use animation callback function. Here is an example.
—
AnjaliHi,
What is happening here is that, when the container is hidden, it’s height and width will be 0 and hence chart takes default width and height of 500 x 400. So You just need to call chart.render() after making the container visible so that chart updates its width and height. We have demonstrated the same in the previous example.
—
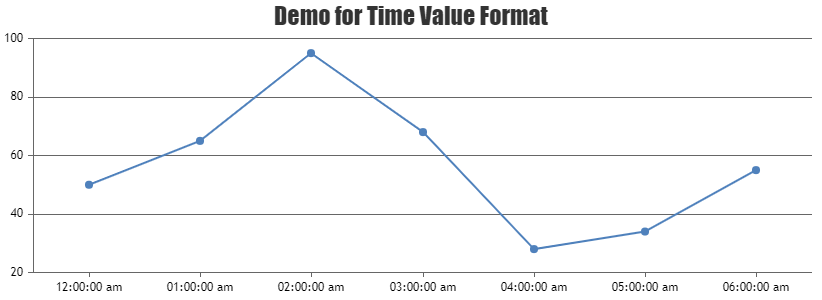
AnjaliHi,
CanvasJS Expects the value to be either timeStamp or Date object – strings are not parsed automatically. Hence you can either parse the date at client side or use the time Stamp value.
For displaying the time in axis labels, you can set the valueFormatString property to
hh:mm:ss tt.Please take a look at this JSFiddle.
___
AnjaliHi,
As of now changing labelAngle is the only solution for this. We’ll look into this issue in future version.
—
AnjaliHi,
When the container is hidden it will take the height and width 0 so that canvas is using it’s default width and height (500 * 400). So You just need to call chart.render() after you are going to show the div in which you are plotting the chart so that chart will use the width and height of container. Here is an example.
__
AnjaliHi,
You just need to call chart.render() after you are going to show the div in which you are plotting the chart. Here is an example.
__
Anjali -
This reply was modified 11 years, 10 months ago by