You must be logged in to post your query.
Home › Forums › Chart Support › Possible to disable tooltips for one dataset?
Is it possible to use multiple datasets and just have the tooltips work on one of them?
What I want to do is have an area chart that shows real time based data. And have an extra line that shows a projection for the last – say – month in the chart. Also I want to show a line that is averaged value of the surrounding data. So that will not be a straight line (which I could solve with a striplines) but a new data set.
I only want the tooltips to work on the real data (area type).
Here an example of the projection lines:
@nonumber,
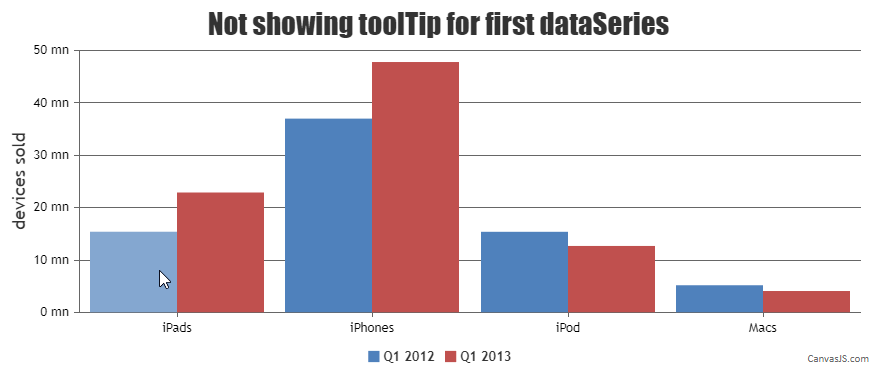
Yes, It is possible to not show the tool-tip for certain dataSeries alone. You can do so by setting null to toolTipContent property of dataSeries for which you don’t want to show the tool-tip.
Please take a look at the code snippet below,
{ type: "column", toolTipContent: null, showInLegend: true, name: "Apple Q1 2012", dataPoints: [ {y: 15.40, label: "iPads" }, {y: 37.00, label: "iPhones" }, {y: 15.40, label: "iPod" }, {y: 5.20, label: "Macs" } ] },
Kindly take a look at this JSFiddle for an example on not showing tool-tip for a specific data-series.
__ Anjali Team CanvasJS
Thanks! :)
You must be logged in to reply to this topic. Login/Register