CanvasJS Chart v3.6.6 & StockChart v1.6.6 GA Released
Today we are releasing CanvasJS Chart v3.6.6 & StockChart v1.6.6 GA with a few bug fixes. Below is a summary of this release. Chart Release Update Bug Fixes In some cases, error was being thrown when empty array was passed as datapoints. StockChart Release Update Bug Fixes Error was being thrown when
CanvasJS Chart v3.6.5 & StockChart v1.6.5 GA Released
Today we are releasing CanvasJS Chart v3.6.5 & StockChart v1.6.5 GA with a few bug fixes. Below is a summary of this release. Release Update (Chart & StockChart) Bug Fixes In some cases of reversed axis, bevelEnabled was not working properly. Do download the latest version from our download page and let
CanvasJS Chart v3.6.4 & StockChart v1.6.4 GA Released
Today we are releasing CanvasJS Chart v3.6.4 & StockChart v1.6.4 GA with a few bug fixes. Below is a summary of this release. Release Update (Chart & StockChart) Bug Fixes In some cases of multi-series chart, color applied to dataseries name within the tooltip was not proper. Do download the latest version
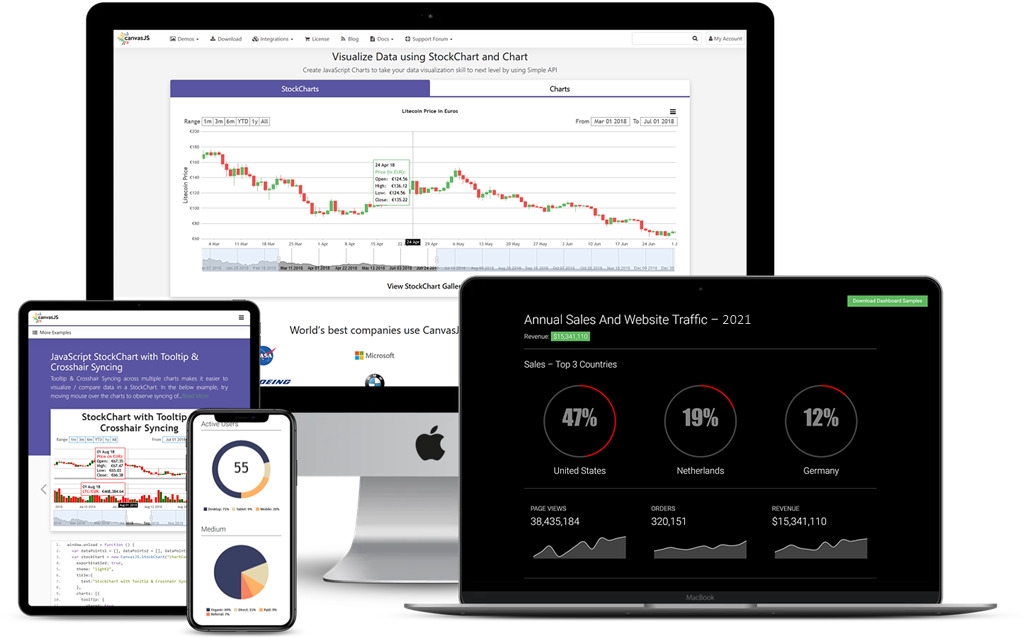
CanvasJS Angular Chart Component Released
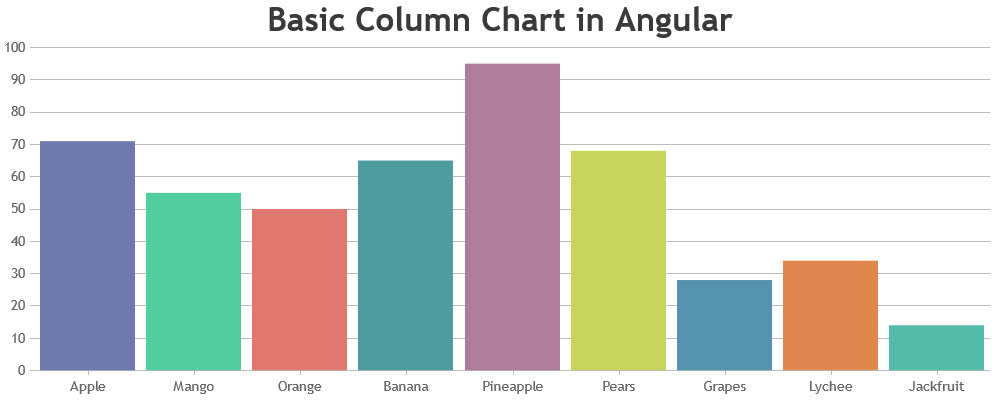
Today we are excited to release the most awaited Angular Component for CanvasJS Chart. Till now the charts used to work fine with Angular but didn’t have a component. But, given the popularity of Angular, we thought of implementing component for the same. So, if you are Angular Developer, you should feel at-home while using
CanvasJS Chart v3.6.3 & StockChart v1.6.3 GA Released
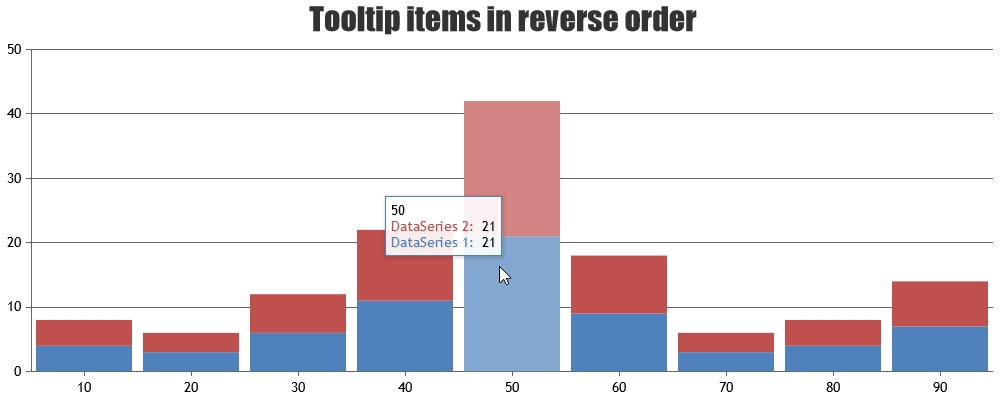
Today we are releasing CanvasJS Chart v3.6.3 & StockChart v1.6.3 GA with a few bug fixes. Below is a summary of this release. Release Update (Chart & StockChart) Bug Fixes Color applied to dataseries name in the tooltip was not proper when reversed property was set to true. Do download the latest
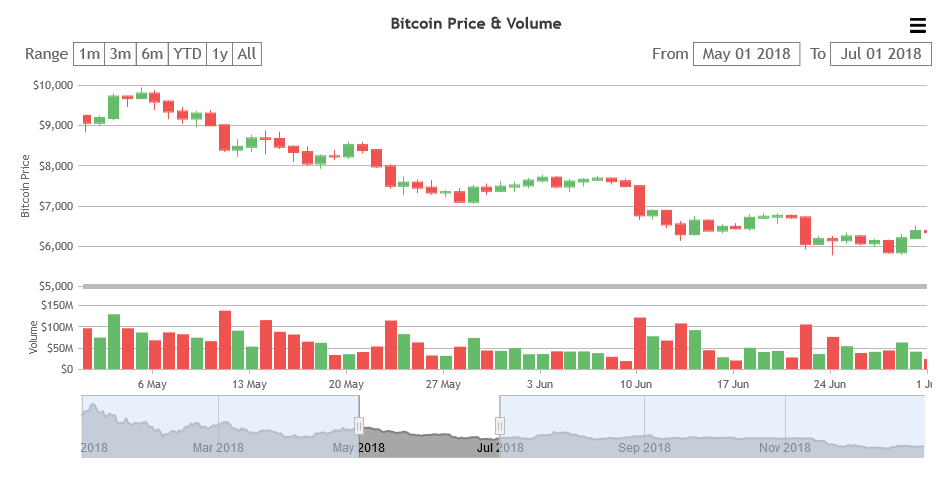
CanvasJS StockChart v1.6.2 GA Released
Today we are releasing CanvasJS StockChart v1.6.2 GA with a few bug fixes. Below is a summary of this release. Release Update Bug Fixes In some cases, slider left handle was not moveable beyond its initial position. Do download the latest version from our download page and let us know your feedback.
CanvasJS Chart v3.6.1 & StockChart v1.6.1 GA Released
Today we are releasing CanvasJS Chart v3.6.1 & StockChart v1.6.1 GA with a few bug fixes. Below is a summary of this release. Release Update (Chart & StockChart) Bug Fixes In some cases, error was being thrown when same style object was passed as containerProps to multiple react chart components. Do download
CanvasJS Chart v3.6 & StockChart v1.6 GA Released
Today we are releasing CanvasJS Chart v3.6 & StockChart v1.6 GA with a few enhancements. Below is a summary of this release. Release Update (Chart & StockChart) Enhancements Improved resource handling while rendering the chart which reduces memory consumption and also makes dynamic updates smoother. Improved resource handling in destroy method of chart
CanvasJS Chart v3.5 & StockChart v1.5 GA Released
Today we are releasing CanvasJS Chart v3.5 & StockChart v1.5 GA with a few enhancements related to CSP. Below is a summary of this release. Release Update (Chart & StockChart) New Features & Enhancement Charts & StockCharts are compatible with CSP (Content-Security-Policy) for inline-styles. Checkout Chart v3.5 & StockChart v1.5 Beta-1 Release
CanvasJS Chart v3.5 & StockChart v1.5 Beta 1 Released
Today we are releasing CanvasJS Chart v3.5 Beta 1 & StockChart v1.5 Beta 1 with a few enhancements related to CSP. Below is a summary of this release. Release Update (Chart & StockChart) New Features & Enhancement Charts & StockCharts are compatible with CSP (Content-Security-Policy) for inline-styles. When Content-Security-Policy is enabled, it