CanvasJS Chart v3.2.6 & StockChart v1.2.6 GA Released
Today we are releasing CanvasJS Chart v3.2.6 & StockChart v1.2.6 GA with a few bug fixes. Below is a summary of this release. Release Update (Chart & StockChart) Bug Fixes In some cases, axisY labels were getting wrapped character-by-character. Error was being thrown when all dataseries are hidden by default and mouse is
CanvasJS Chart v3.2.5 & StockChart v1.2.5 GA Released
Today we are releasing CanvasJS Chart v3.2.5 & StockChart v1.2.5 GA with a few bug fixes. Below is a summary of this release. Release Update (Chart & StockChart) Bug Fixes In chromium based browsers, indexlabels were not getting aligned with the bar properly. Thanks to guilhermemaranhao for reporting this bug. Do
CanvasJS Chart v3.2.4 & StockChart v1.2.4 GA Released
Today we are releasing CanvasJS Chart v3.2.4 & StockChart v1.2.4 GA with a few bug fixes. Below is a summary of this release. Release Update (Chart & StockChart) Bug Fixes In some cases of logarithmic axis, auto-calculated axis range (minimum & maximum) was not proper. Do download the latest version from our download
CanvasJS Chart v3.2.3 & StockChart v1.2.3 GA Released
Today we are releasing CanvasJS Chart v3.2.3 & StockChart v1.2.3 GA with a few bug fixes. Below is a summary of this release. Release Update (Chart & StockChart) Bug Fixes Stripline labels were looking bold when they were positioned outside & showOnTop was set to true. In some cases of logarithmic axis, stripline with
CanvasJS StockChart v1.2.2 GA Released
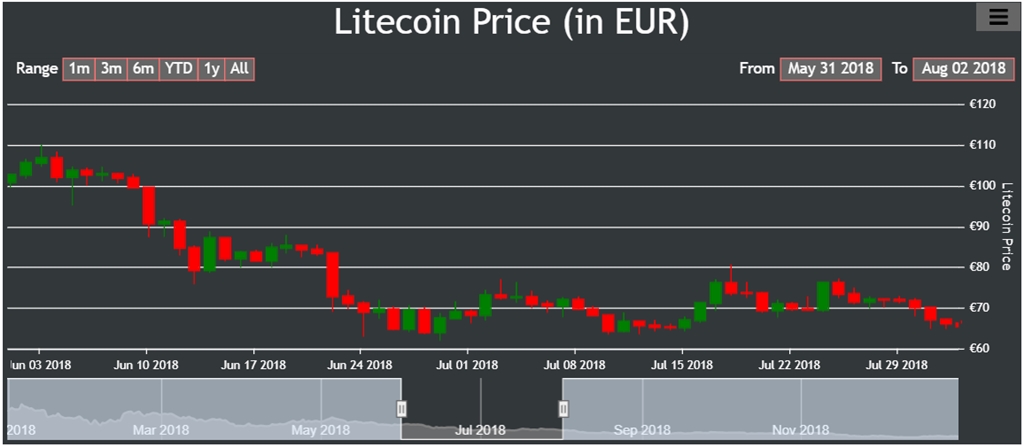
Today we are releasing CanvasJS StockChart v1.2.2 GA with a few bug fixes. Below is a summary of this release. Release Update Bug Fixes In some cases axis labels were getting clipped when they were wrapped. Do download the latest version from our download page and let us know your feedback. Thank
CanvasJS StockChart v1.2.1 GA Released
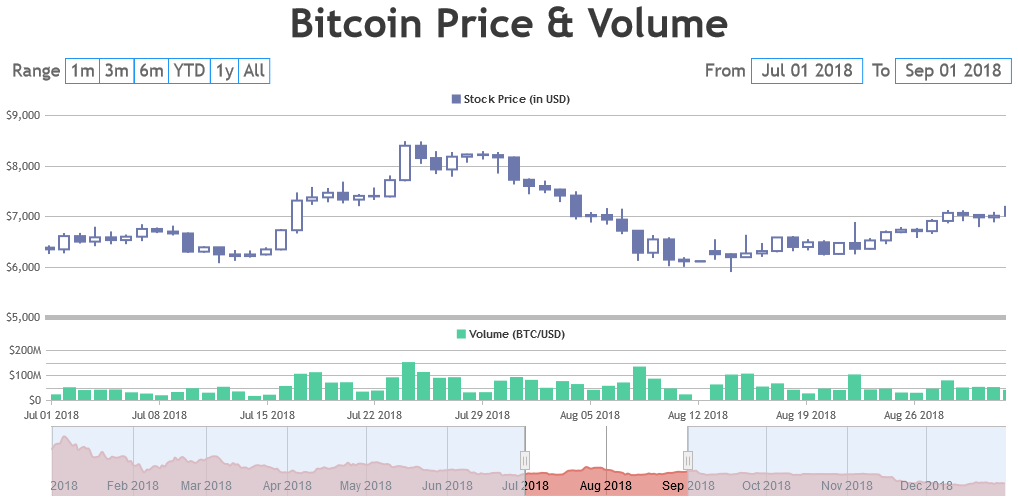
Today we are releasing CanvasJS StockChart v1.2.1 GA with an improvement. Below is a summary of this release. Release Update Improvement Improved navigator behaviour in touch based devices. Do download the latest version from our download page and let us know your feedback. Thank You, Vishwas R Team CanvasJS
CanvasJS Chart v3.2 & StockChart v1.2 GA Released
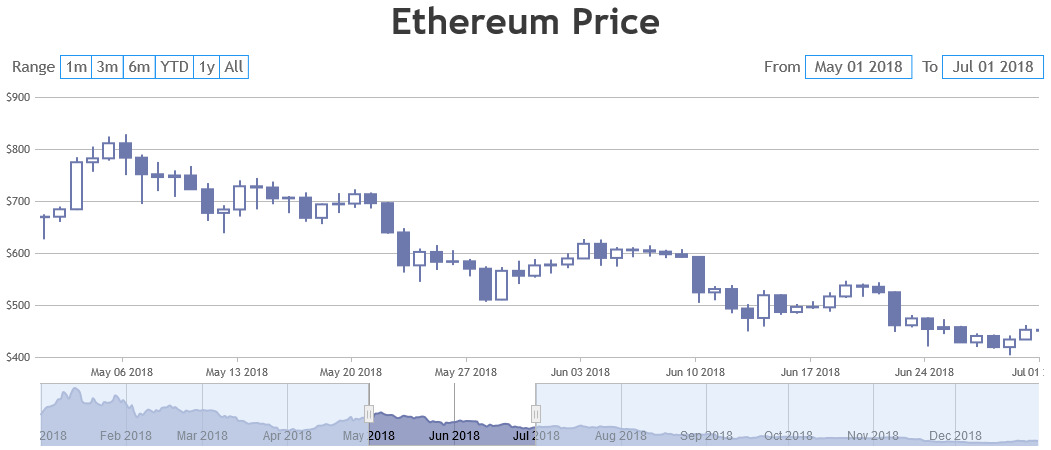
Today we are releasing CanvasJS Chart v3.2 & StockChart v1.2 GA with a few features & bug fixes. Below is a summary of this release. StockChart Release Update Bug Fixes On iOS devices, slider & handles were getting highlighted on tapping it. Text within Inputfields were not getting aligned to center. In few
CanvasJS Chart v3.2 & StockChart v1.2 Beta 1 Released
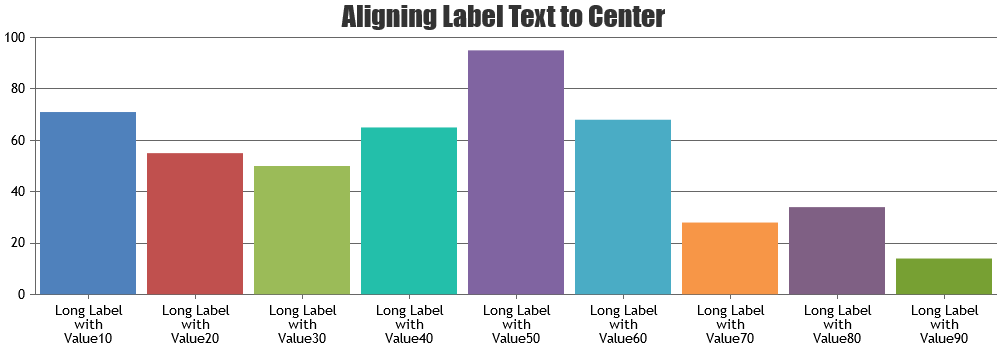
Today we are releasing CanvasJS Chart v3.2 Beta 1 & StockChart v1.2 Beta 1 with a few features & bug fixes. Below is a summary of this release. Release Update (Chart & StockChart) New Features & Enhancement Added labelTextAlign property in all the axes which lets you align text in axis label. This
CanvasJS Chart v3.1 & StockChart v1.1 GA Released
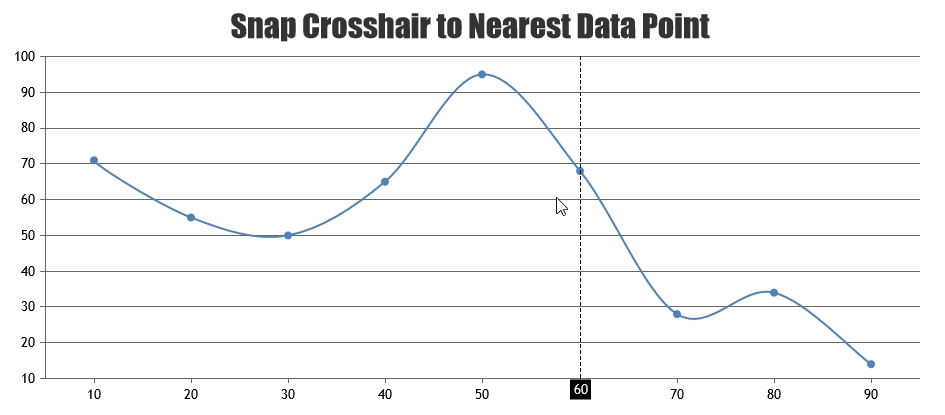
Today we are releasing CanvasJS Chart v3.1 & StockChart v1.1 GA with a few bug fixes. Below is a summary of this release. Release Update Bug Fixes (Charts & StockCharts) Crosshair was not being shown when axis was reversed & snapToDataPoint was set to true. When snapToDataPoint was set to true, crosshair was being
CanvasJS Chart v3.1 & StockChart v1.1 Beta 1 Released
Today we are releasing CanvasJS Chart v3.1 Beta 1 & StockChart v1.1 Beta 1 with a few bug fixes. Below is a summary of this release. Chart Release Update Bug Fixes Error was thrown in touch devices due to change in passive event listener behavior in latest browser updates. Chart bug fixes are