CanvasJS Chart v3.4.1 & StockChart v1.4.1 GA Released
Today we are releasing CanvasJS Chart v3.4.1 & StockChart v1.4.1 GA with a few bug fixes. Below is a summary of this release. Release Update (Chart & StockChart) Bug Fixes In some cases, culture of toolbar elements was not getting applied on updating it dynamically. Do download the latest version from our
CanvasJS Chart v3.4 & StockChart v1.4 GA Released
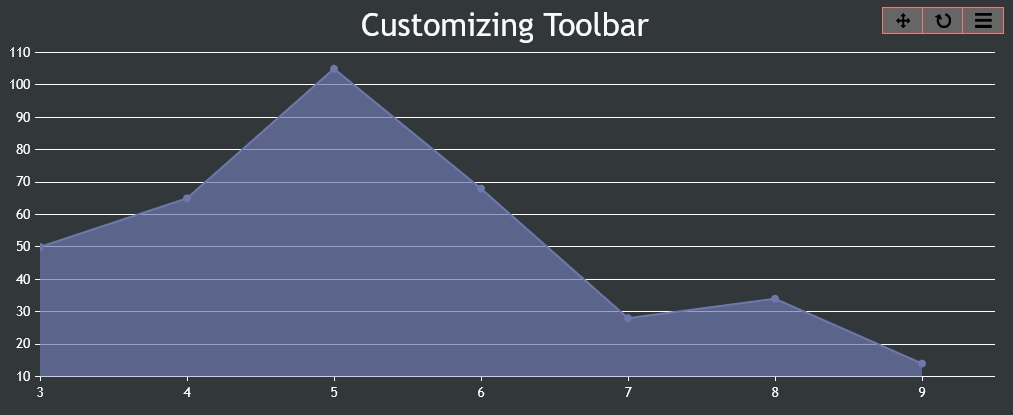
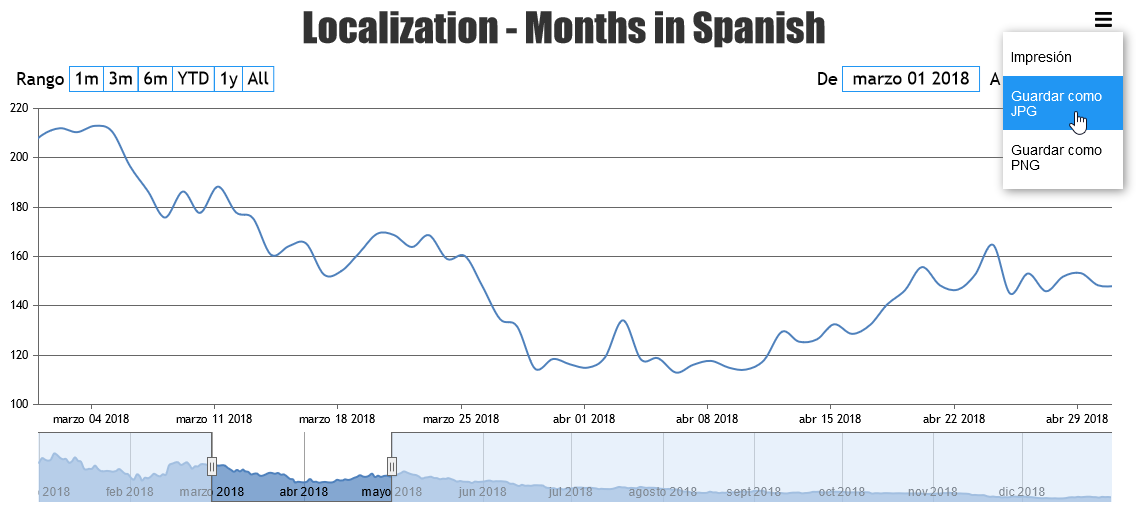
Today we are releasing CanvasJS Chart v3.4 & StockChart v1.4 GA with a few features & a few bug fixes. Below is a summary of this release. Release Update (Chart & StockChart) New Features & Enhancement toolbar – lets you customize look & feel of toolbar options (zoom/pan button, reset button, export-menu &
CanvasJS Chart v3.4 & StockChart v1.4 Beta 1 Released
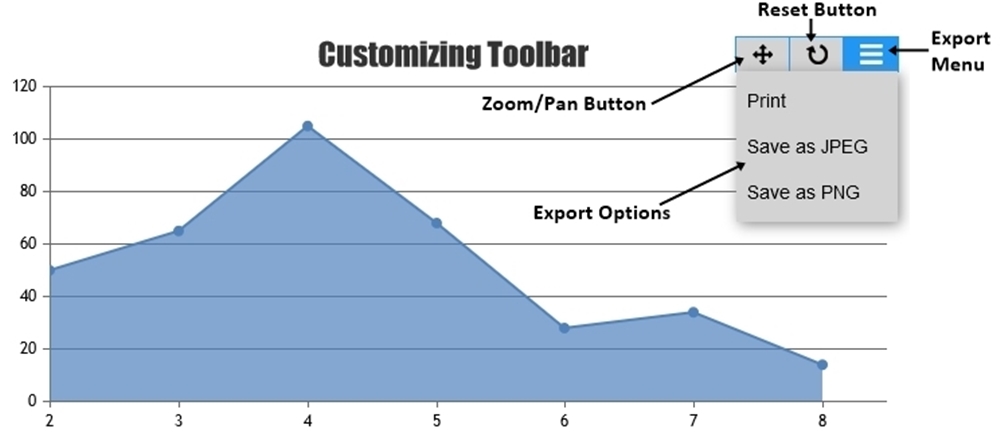
Today we are releasing CanvasJS Chart v3.4 & StockChart v1.4 Beta 1 with a few features. Below is a summary of this release. Release Update (Chart & StockChart) New Features & Enhancement toolbar object – lets you customize look & feel of toolbar options (zoom/pan button, reset button, export-menu & export-options). itemBackgroundColor –
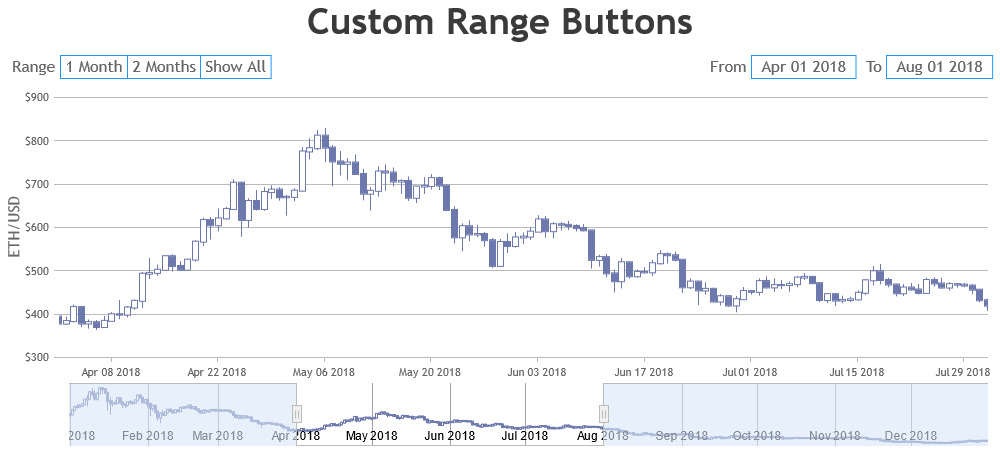
CanvasJS StockChart v1.3.5 GA Released
Today we are releasing CanvasJS StockChart v1.3.5 GA with a few bug fixes. Below is a summary of this release. Release Update Bug Fixes Label was not getting removed when range-buttons were removed dynamically. Do download the latest version from our download page and let us know your feedback. Thank You, Vishwas
CanvasJS StockChart v1.3.4 GA Released
Today we are releasing CanvasJS StockChart v1.3.4 GA with a few bug fixes. Below is a summary of this release. Release Update Bug Fixes Error was being thrown in some cases when range-buttons were disabled. Do download the latest version from our download page and let us know your feedback. Thank You,
CanvasJS StockChart v1.3.3 GA Released
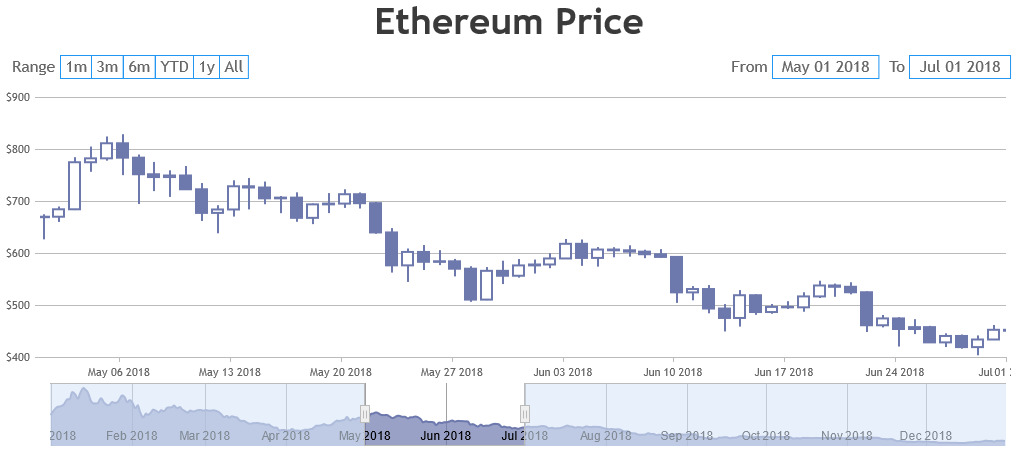
Today we are releasing CanvasJS StockChart v1.3.3 GA with a few bug fixes. Below is a summary of this release. Release Update Bug Fixes In some cases, inputfields were re-appearing after disabling it dynamically. Do download the latest version from our download page and let us know your feedback. Thank You, Vishwas
CanvasJS Chart v3.3.2 & StockChart v1.3.2 GA Released
Today we are releasing CanvasJS Chart v3.3.2 & StockChart v1.3.2 GA with a few bug fixes. Below is a summary of this release. Release Update (Chart & StockChart) Bug Fixes In some cases, extra space was getting reserved for legend to the top / bottom of the chart – even when verticalAlign was
CanvasJS Chart v3.3.1 & StockChart v1.3.1 GA Released
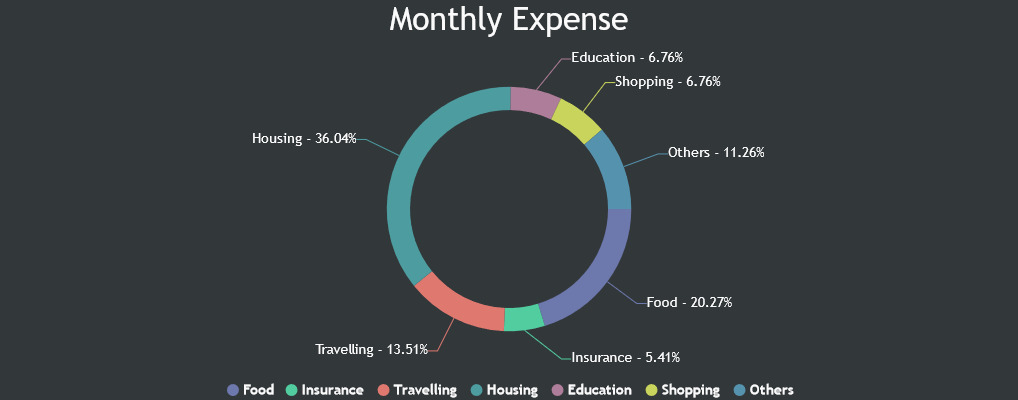
Today we are releasing CanvasJS Chart v3.3.1 & StockChart v1.3.1 GA with a few bug fixes. Below is a summary of this release. Release Update (Chart & StockChart) Bug Fixes Error was being thrown in some cases of pie, doughnut, funnel & pyramid charts with indexlabels. Do download the latest version from
CanvasJS Chart v3.3 & StockChart v1.3 GA Released
Today we are releasing CanvasJS Chart v3.3 & StockChart v1.3 GA with a new feature & a few bug fixes. Below is a summary of this release. Release Update (Chart & StockChart) New Features & Enhancement Added indexLabelTextAlign property which lets you align text in indexlabel. This feature is useful whenever the indexlabel
CanvasJS Chart v3.3 & StockChart v1.3 Beta 1 Released
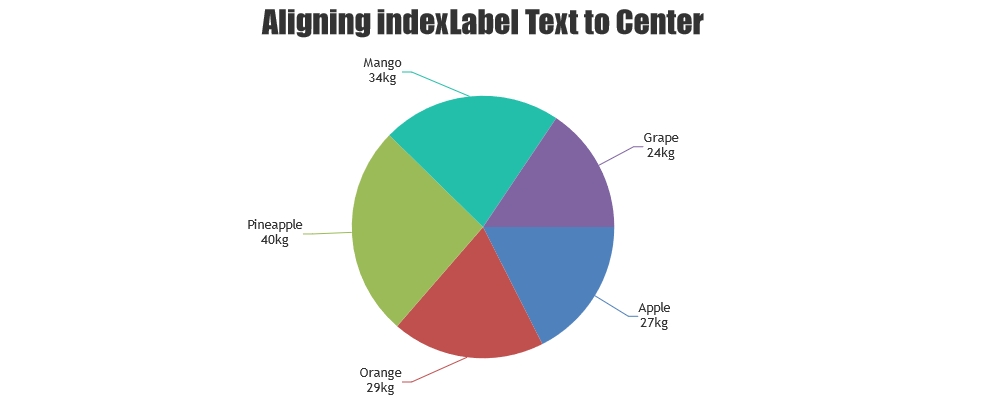
Today we are releasing CanvasJS Chart v3.3 & StockChart v1.3 Beta 1 with a new feature. Below is a summary of this release. Release Update (Chart & StockChart) New Features & Enhancement Added indexLabelTextAlign property which lets you align text in indexlabel. This feature is useful whenever the indexlabel text is wrapped into